


EN
Will Copper’s Bull Market Continue?
I asked whether copper was going to trade $7 per pound in an August 8, 2026, Barchart article, where I concluded with the following:
COMEX copper has pulled back to just above $6.60 per pound, and the CPER ETF to just over $40 per share. If copper futures are heading toward $7 or higher, the CPER ETF will likely ride the bullish wave. Given the bullish trend, copper futures at the $7 level is not out of the question by the end of 2026.
COMEX copper traded at $6.61 per pound, LME forwards were $14,282.50 per ton, and the CPER ETF was $40.02 per share in late August 2026. In early November, the futures, forwards, and CPER ETF were steady.
Futures and forwards are near record highs
COMEX copper futures remain in a bullish trend in 2026 and are closer to this year’s high than low in early November.
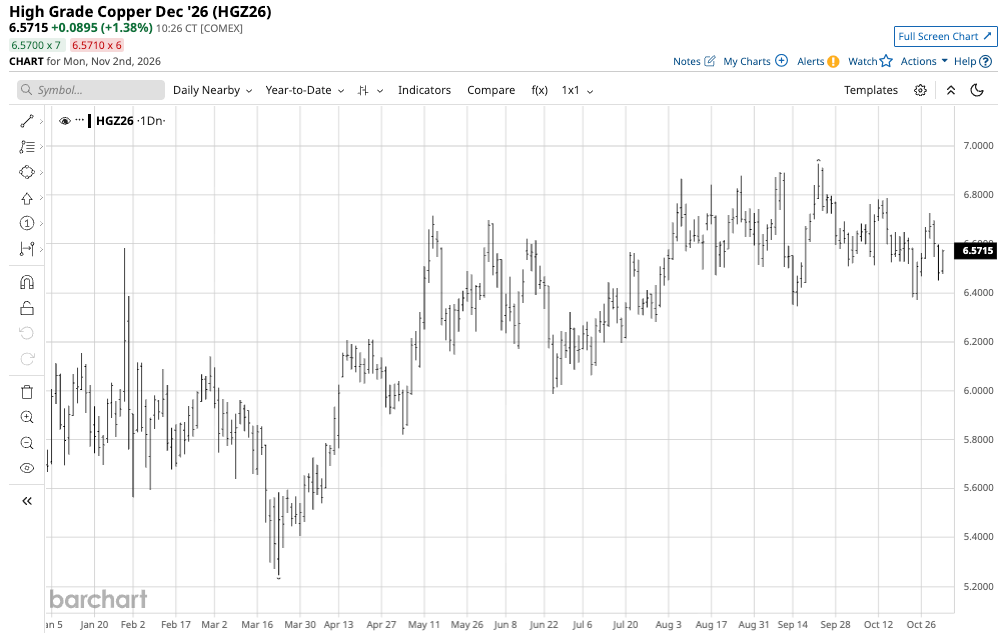
The daily continuous contract COMEX copper futures chart shows the pattern of higher lows and higher highs that took copper futures to a record high of $6.9285 per pound on September 22, 2026. At around $6.57 per pound in early November, copper futures remain close to the all-time peak price.
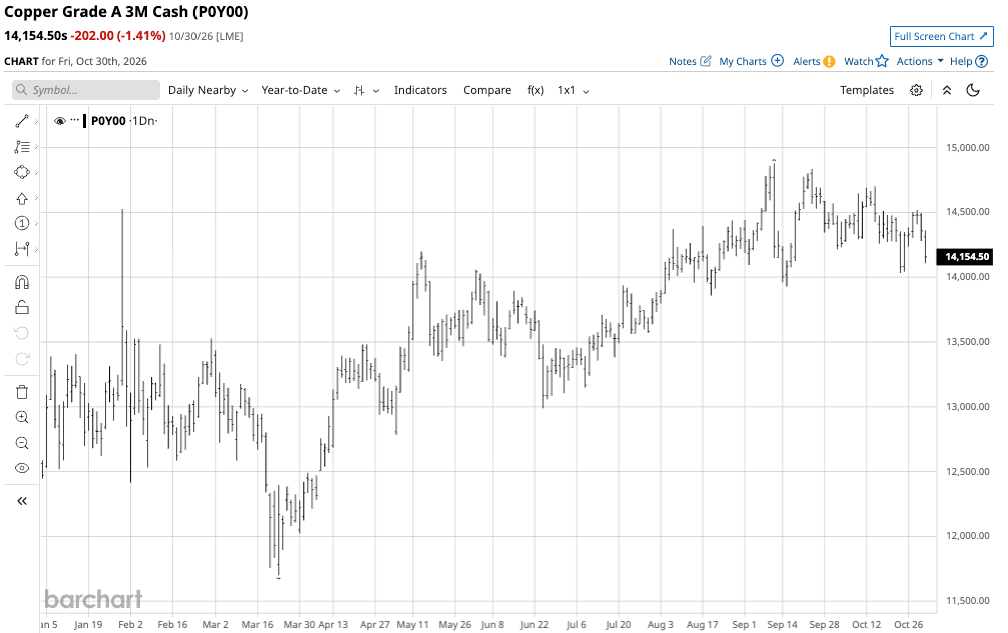
The daily continuous contract three-month LME copper forwards chart shows the pattern of higher lows and higher highs that took copper forwards to a record high of $14,875 per metric ton on September 10, 2026. At around $14,154.50 per ton on October’s final trading session, copper forwards remain close to the all-time peak price.
Copper fundamentals remain bullish, but the odds of a correction have increased
Copper demand continues to outstrip supplies, with UBS analysts expecting the global copper deficit to widen from 219,000 tons in 2026 to 379,000 tons in 2027. UBS raised its 2027 price forecast, projecting a new record high of $15,500 per ton.
In an October 14, 2026, article, Marina Mayer outlined how both copper and nickel prices could double from their current levels within a decade. The fundamental deficit, demand from clean energy initiatives, refined copper’s deficit, trade sanctions and tariffs, and Chinese refining dominance support continued higher highs. Copper’s bull market began at the beginning of this century.
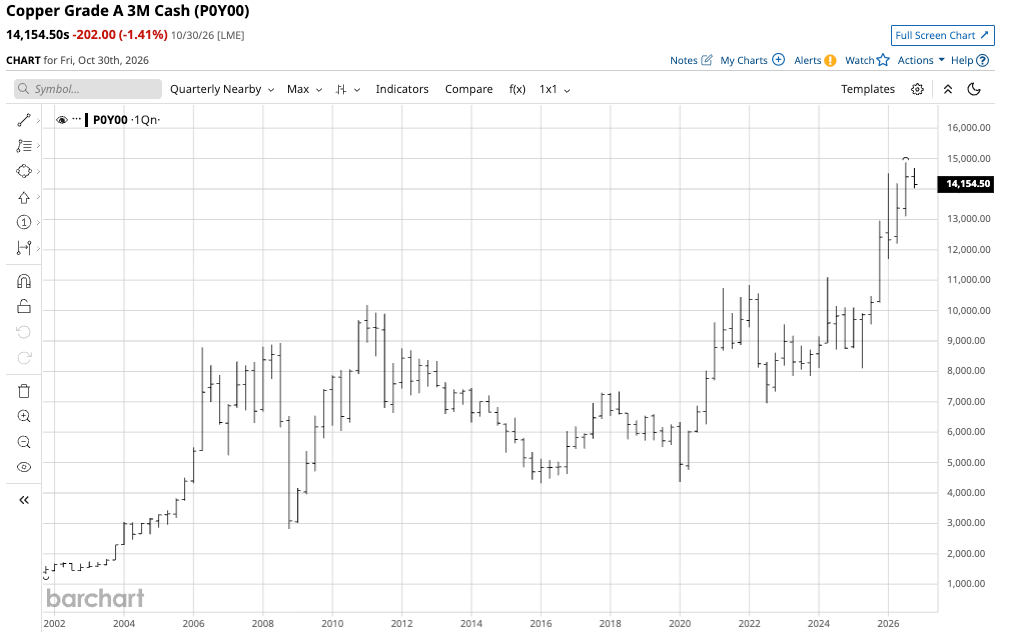
The long-term quarterly chart of LME copper forwards highlights the pattern of higher lows and higher highs. LME copper’s price has risen more than ten times from the late 2001 low of $1,336 per metric ton.
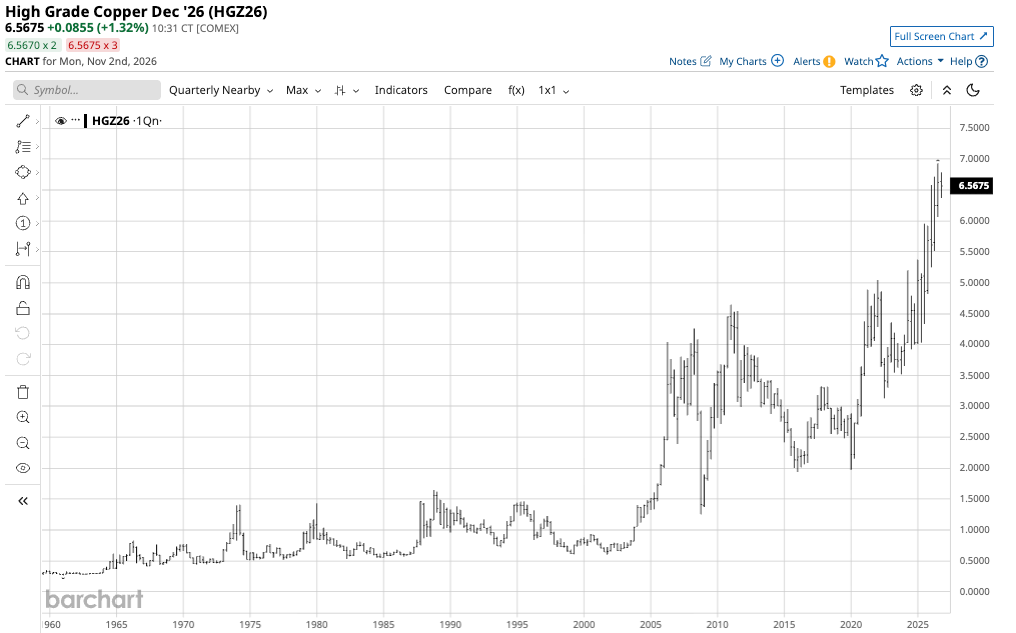
The long-term quarterly chart of COMEX copper futures highlights the pattern of higher lows and higher highs. COMEX copper’s price has also moved over ten times higher than the late 2001 low of 60.40 cents per pound.
New highs can lead to substantial downdrafts
While forwards and futures have not violated previous significant lows for over a quarter of a century, new highs have often led to significant corrections that held the rising technical support level.
In the futures, copper’s price fell 70.5% from the Q2 2008 record high of $4.2605 to the Q4 2008 low of $1.2550 per pound. However, copper futures held above the previous support at the Q4 2001 low. The copper futures corrected 58.4% from the Q1 2011 record high of $4.6495 to a low of $1.9355 in Q1 2016. In Q1 2020, after a recovery that took copper to a high of $3.2220 in Q4 2017, copper futures corrected 38.8% to $1.9725. While copper prices fell as the global pandemic gripped markets across all asset classes, the red nonferrous metal still made a higher low and established higher support. Copper has not traded below $2 per pound since Q1 2020. After reaching a new record high of $5.0395 in Q1 2022, the price fell 37.9% to a low of $3.1315 in Q3 2022. While trading ranges have been wide, copper futures have made higher lows and higher highs since Q3 2022, trading over $3 since Q4 2020, over $4 since Q3 2025, and above $5 per pound since Q1 2026.
Meanwhile, LME three-month copper forwards have followed the same long-term bullish path. While the copper bull continues in November 2026, the historical trading pattern warns that the odds of another substantial correction are rising as prices climb.
Levels to watch in COMEX futures and LME forwards
The ten-month monthly charts highlight key support and resistance levels in LME copper forwards and COMEX copper futures.
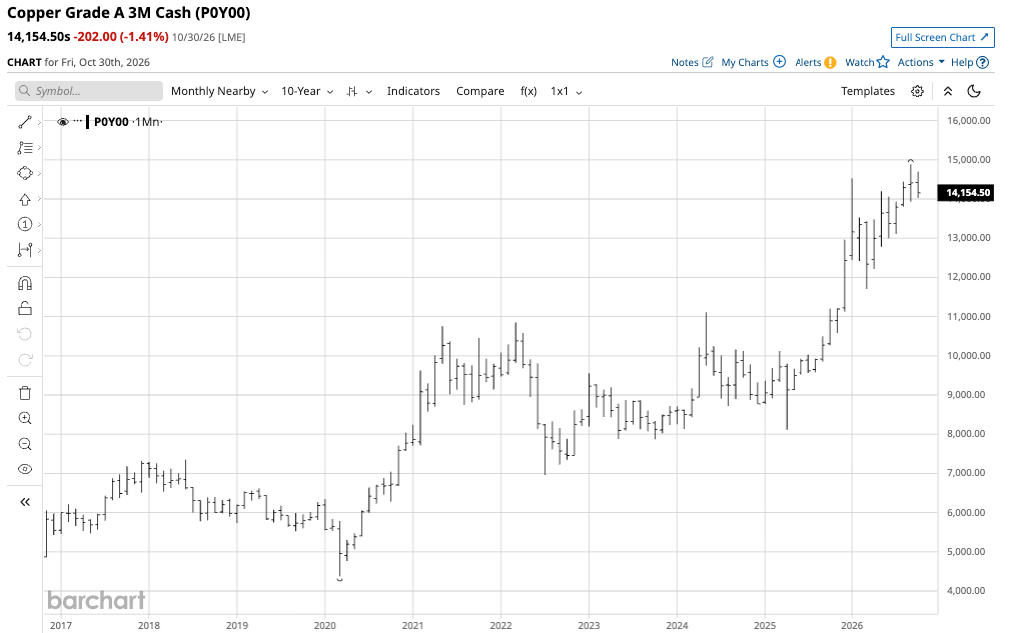
The chart shows that technical support and resistance levels for LME forwards are currently at the March 2026 low of $11,700 and the September 2026 high of $14,875 per ton. With forwards at $14,154.50 in late October, support was 17.3% below, and resistance was 5% above the current price.
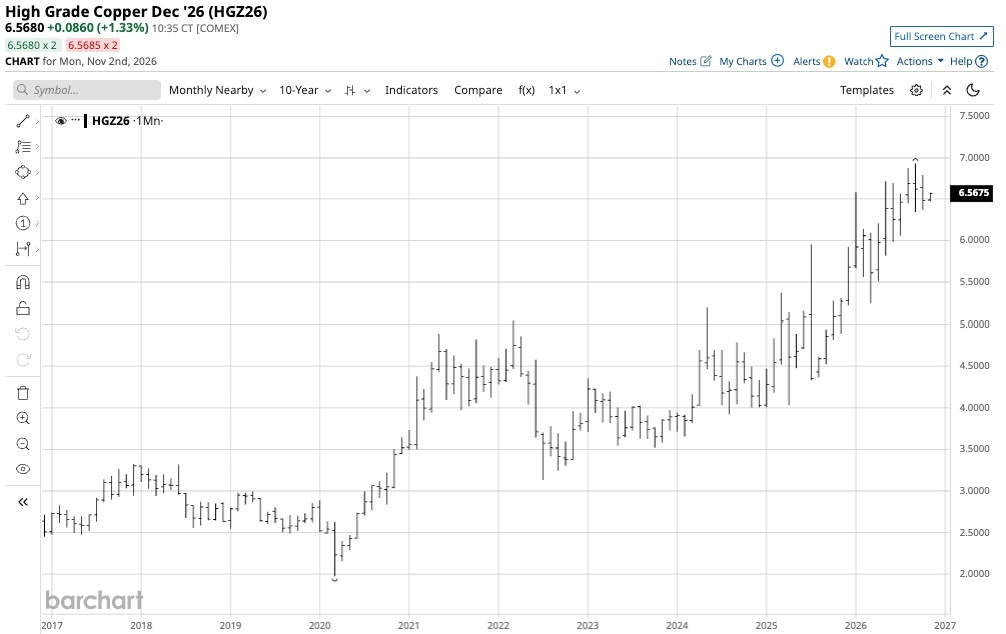
The chart shows technical support and resistance levels for COMEX futures at the March 2026 low of $5.2460 and the September 2026 high of $6.9285 per pound. With futures at $6.5680 in early November, support sits 20.1% below and resistance 5.5% above the current price.
CPER does an excellent job tracking copper futures
The most direct routes for a risk position in copper are the CME’s COMEX futures and the LME forward markets. Futures and forwards require specialized accounts, which can be challenging for many market participants not directly involved in the copper business or without access to futures trading.
While many commodity ETFs have exposure to copper along with other metals and commodities, and copper mining stocks such as FCX and SCCO track copper prices, the liquid U.S. Copper ETF (CPER) tracks copper futures prices well. At $39.53 per share, CPER had over $729.1 million in assets under management. CPER trades an average of 416,854 shares per day and charges a 0.88% management fee.
The latest 2026 rally in COMEX copper futures took the price 9.2% higher from a $6.3445 low on September 15 to a high of $6.9285 on September 22.
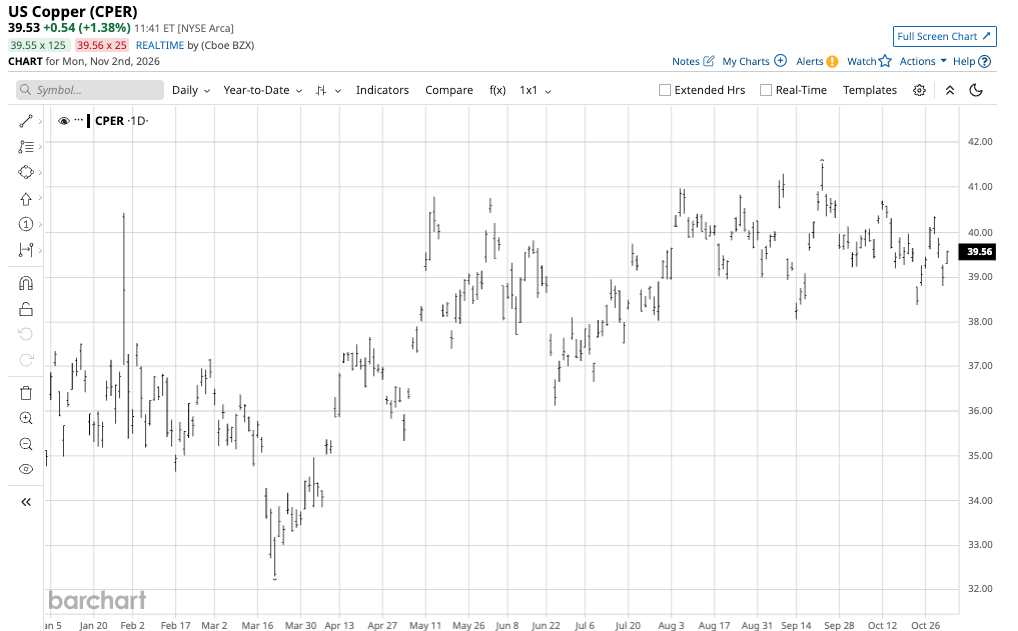
Over a similar period, CPER rose 9.1% from $38.06 to $41.52 per share, as it tracked copper futures well.
One risk is that while copper futures trade around the clock, the CPER ETF is only available during U.S. stock market hours, so it may miss highs or lows that occur when the market is closed.
Copper prospects remain bullish, but historical trading patterns suggest buying during corrections has been optimal. Fundamental and technical factors support a continuation of copper’s bull market, but even the most aggressive bull markets rarely move in straight lines. Each new high in copper could cause corrections, which have been buying opportunities for over a quarter of a century.
On the date of publication, Andrew Hecht did not directly have a position in any of the securities mentioned in this article. All information and data in this article is solely for informational purposes. For more information please view the Barchart Disclosure Policy here.