


EN
What Alliance Resource Partners Stock Earnings Strength Means For Shareholders
- Alliance Resource Partners reported third quarter 2026 revenue of US$603.02 million and net income of US$139.6 million, with basic and diluted earnings per unit from continuing operations of US$1.08, and affirmed a 2026 quarter cash distribution of US$0.60 per unit with a 1.76x coverage ratio.
- Quarterly earnings per unit moved to US$1.08 while nine month earnings per unit held at US$1.76, which highlights how recent coal and royalty performance, disciplined capital returns and updated full year sales volume guidance between 34.50 million and 35.50 million short tons are interacting to shape Alliance Resource Partners’ current cash generation profile.
- We will look at how Alliance Resource Partners’ investment narrative is influenced by higher quarterly earnings per unit and a maintained distribution.
Alliance Resource Partners Investment Narrative Recap
To own Alliance Resource Partners, you need to be comfortable with a coal led cash flow story that is gradually being balanced by oil and gas royalties. The recent quarter showed revenue of US$603.02 million and net income of US$139.6 million, which supports that cash engine for now. The short term swing factor still looks like coal pricing and volumes against cost control, while the main operational risk remains further mine level changes if conditions weaken, especially after the earlier Mettiki impairment.
Coal price normalization and contract mix shifts could still pressure margins, even with full year sales guidance of 34.50 million to 35.50 million short tons. That guidance range suggests the near term focus is on executing existing contracts efficiently, rather than chasing volume upside. For income focused holders, the biggest risk is that earnings or cash flow trend lower relative to a relatively high distribution, which could tighten coverage over time.
The most relevant announcement here is the Board affirming a US$0.60 per unit cash distribution for the 2026 Quarter, with a 1.76x coverage ratio. For anyone considering Alliance Resource Partners as an income vehicle, that decision links directly to the earnings story reported in the third quarter numbers. Higher quarterly earnings per unit of US$1.08 give the partnership more room to support that payout in the near term.
At the same time, there is already a flagged risk that the dividend is not well covered by earnings based on prior data. That makes the current 1.76x coverage ratio an important datapoint, rather than a comfort blanket. If coal pricing trends, further mine adjustments, or fluctuations in the non core Bitcoin holdings hit reported net income, the room to fund both distributions and reinvestment could narrow and become a meaningful catalyst for sentiment.
What The Analyst Scenario Implies For Alliance Resource Partners
Alliance Resource Partners' longer term story in the analyst models leans heavily on modest growth rather than a big step change. The assumptions point to revenue rising by 3.7% each year over the next few years, helped by higher profit margins as the coal and royalty mix shifts. Forecast profit is expected to move from earnings today of US$263.7 million to consensus earnings of US$401.5 million by 2029, which is an earnings increase of about US$137.8 million.
Alliance Resource Partners' narrative projects US$2.4 billion revenue and US$401.5 million earnings by 2029. This requires 3.7% yearly revenue growth and an earnings increase of about US$137.8 million from earnings today of US$263.7 million.
Analysts are also building in a change in how the stock might be valued if those results arrive. Their framework uses a P/E multiple of 12.4x on the 2029 earnings outlook, compared with a P/E of 12.0x today and the current 12.3x level cited for the wider US oil and gas industry. That shift may look small at first glance, yet it indicates the consensus view is not only for higher profits but also for the market to pay a slightly richer price for each dollar of those projected earnings.
For you as an income focused investor, the key question is how these projections stack up against Alliance Resource Partners' coal exposure and royalty plans. Earnings moving from about US$260 million to just over US$400 million would need both higher margins and disciplined capital allocation to hold together, especially if coal contract pricing trends lower than the recent peaks. Any gap between the assumed improvement in profitability and actual mine level results or royalty volumes could push the share price and the implied analyst fair value away from each other in the years ahead.
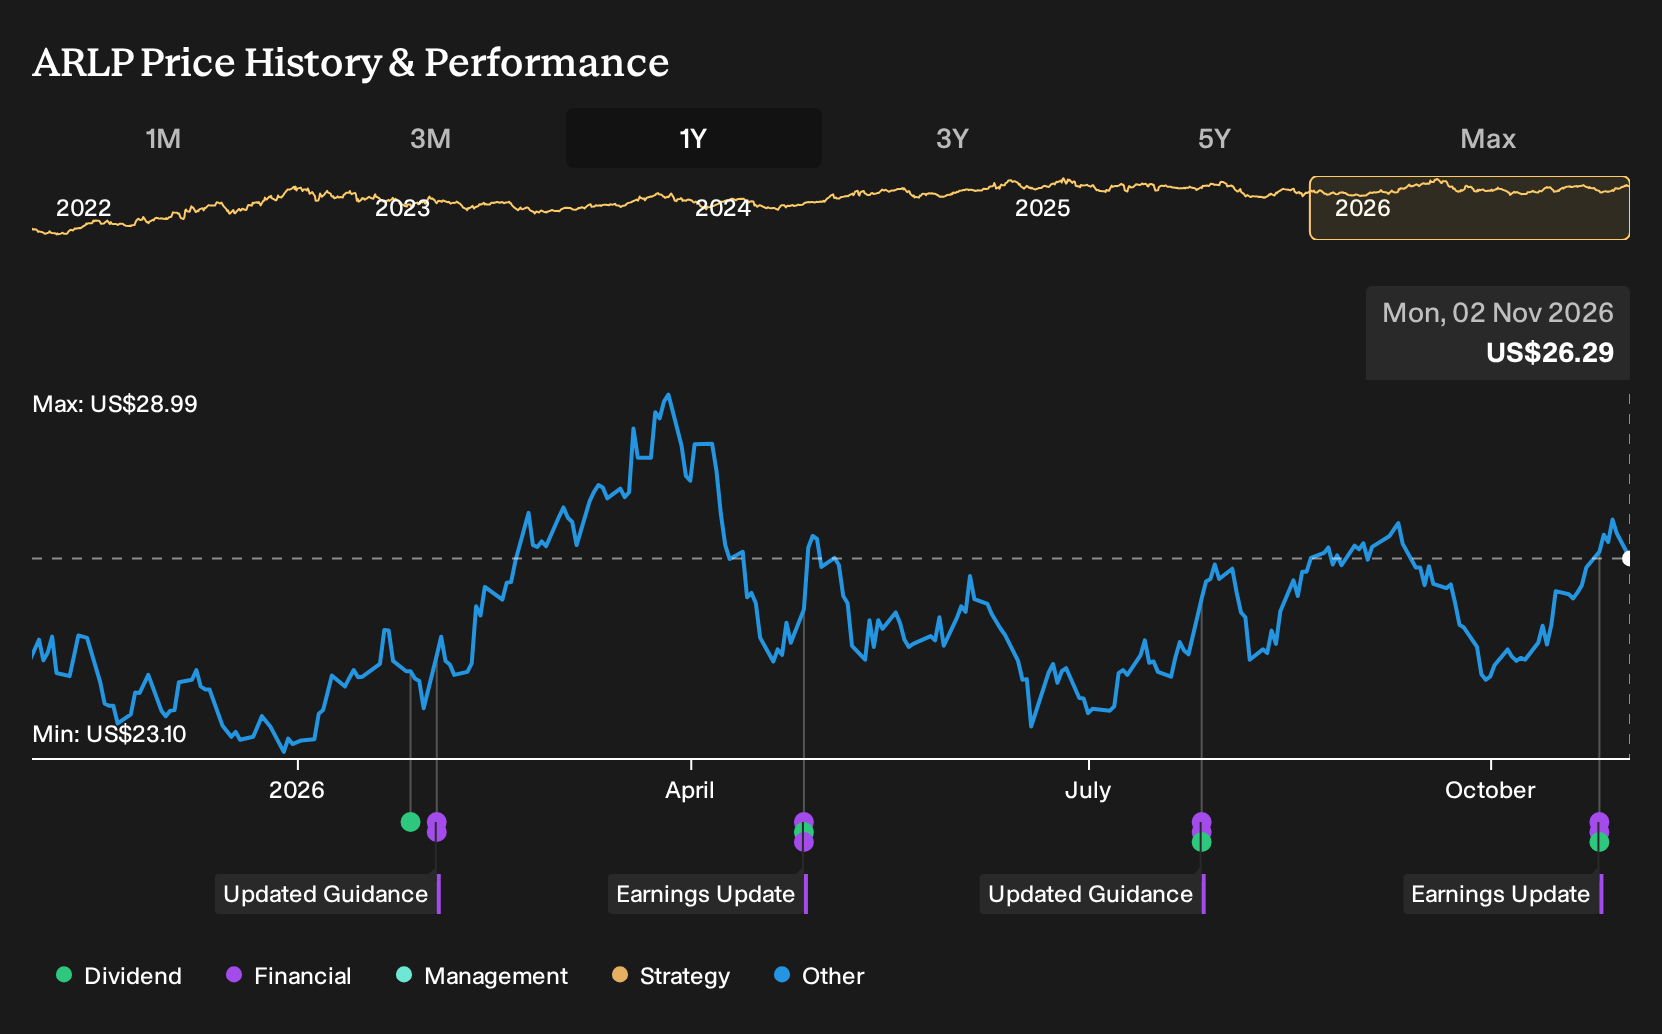
Uncover why Alliance Resource Partners' fair value indicates a 19% potential upside to its current price, which could narrow quickly if sentiment catches up.
Exploring Other Perspectives
Fair value estimates for Alliance Resource Partners from two Simply Wall St Community members span roughly US$31 to US$68 per unit, which shows how far apart individual models can land. Those views also sit alongside risks around coal pricing, mine changes and Bitcoin holdings, so you are weighing sharply different opinions. Consider exploring several viewpoints before deciding what makes sense for you.
Explore another Alliance Resource Partners fair value estimate, including one that suggests potential upside of as much as 159% from the current price!
The Verdict Is Yours
Don't just follow the ticker. Dig into the data and build a conviction that's truly your own.
- A great starting point for your Alliance Resource Partners research is our analysis highlighting 4 key rewards and 1 important warning sign that could impact your investment decision.
- See our latest analysis for Alliance Resource Partners. The report includes a comprehensive fundamental analysis summarized in a single visual, the Snowflake, making it easy to evaluate Alliance Resource Partners' overall financial health at a glance.
Looking For More Investment Ideas Beyond Alliance Resource Partners?
If Alliance Resource Partners fits your income and cash flow checklist, it can still pay to widen the field and compare it with other businesses that share similar traits. Use the Simply Wall St Screener to line up different options side by side, pressure test your thesis, and spot alternatives that might suit your risk tolerance better.
- For investors who want income with resilience, start with a 4 dividend fortresses that focus on payouts backed by stronger underlying financials.
- If capital preservation is front of mind, consider companies in the 29 resilient stocks with low risk scores that screen for steadier balance sheets and lower risk scores.
- When you are hunting for something less crowded, scan the 19 high quality undiscovered gems that pair solid fundamentals with relatively limited market attention.
Have feedback on this article? Concerned about the content? Get in touch with us directly. Alternatively, email editorial-team@simplywallst.com