


EN
Did Earnings Beat Just Shift T. Rowe Price's (TROW) Investment Narrative?
- T. Rowe Price Group reported third quarter 2026 revenue of US$2,004.9 million and net income of US$612.3 million, with diluted EPS from continuing operations of US$2.79.
- Results highlighted stronger fixed income, alternatives, ETF and model portfolio activity that helped offset equity outflows and framed management’s focus on product mix and capital deployment.
- We will now look at how T. Rowe Price Group’s investment narrative may shift given ETF and model portfolio strength in these results.
Scan how T. Rowe Price Group’s ETF and model portfolio momentum compares with other asset managers by reviewing a curated set of 34 high quality undervalued stocks that show similar business profiles and strong fundamentals.
T. Rowe Price Group Investment Narrative Recap
T. Rowe Price Group appeals to shareholders who favor a gradual pivot from traditional active mutual funds toward ETFs, SMAs, retirement solutions and alternatives, while still contending with fee pressure and higher costs. The third quarter showed that fixed income, ETF and model portfolio inflows can help steady revenue even as equity strategies see outflows.
The key short-term swing factor is whether these newer vehicles continue to attract assets quickly enough to offset active equity outflows and a lower effective fee rate. The main operational risk is that expenses, already guided to rise 4% to 7% in 2026, remain elevated while advisory fee margins stay under pressure.
The latest quarterly report is the clearest operational marker tied to those catalysts. Revenue for the third quarter was US$2,004.9 million compared with US$1,893.5 million a year ago, while net income was US$612.3 million compared with US$646.1 million. Diluted EPS from continuing operations was US$2.79 compared with US$2.87.
Across the first nine months of 2026, revenue of US$5,769.3 million compared with US$5,380.7 million and net income of US$1,742.5 million compared with US$1,641.8 million show how T. Rowe Price Group is already relying on fixed income, ETFs, SMAs and alternatives to support earnings. For investors, the key issue is whether that mix shift can continue to offset fee compression and equity outflows while costs drift higher.
T. Rowe Price Group's narrative projects US$7.6b revenue and US$2.3b earnings by 2029. This aligns with analysts assuming fairly flat yearly revenue growth and implies an earnings increase of about US$0.1b from current earnings of roughly US$2.2b.
Uncover why T. Rowe Price Group's fair value is essentially in line with its current price.
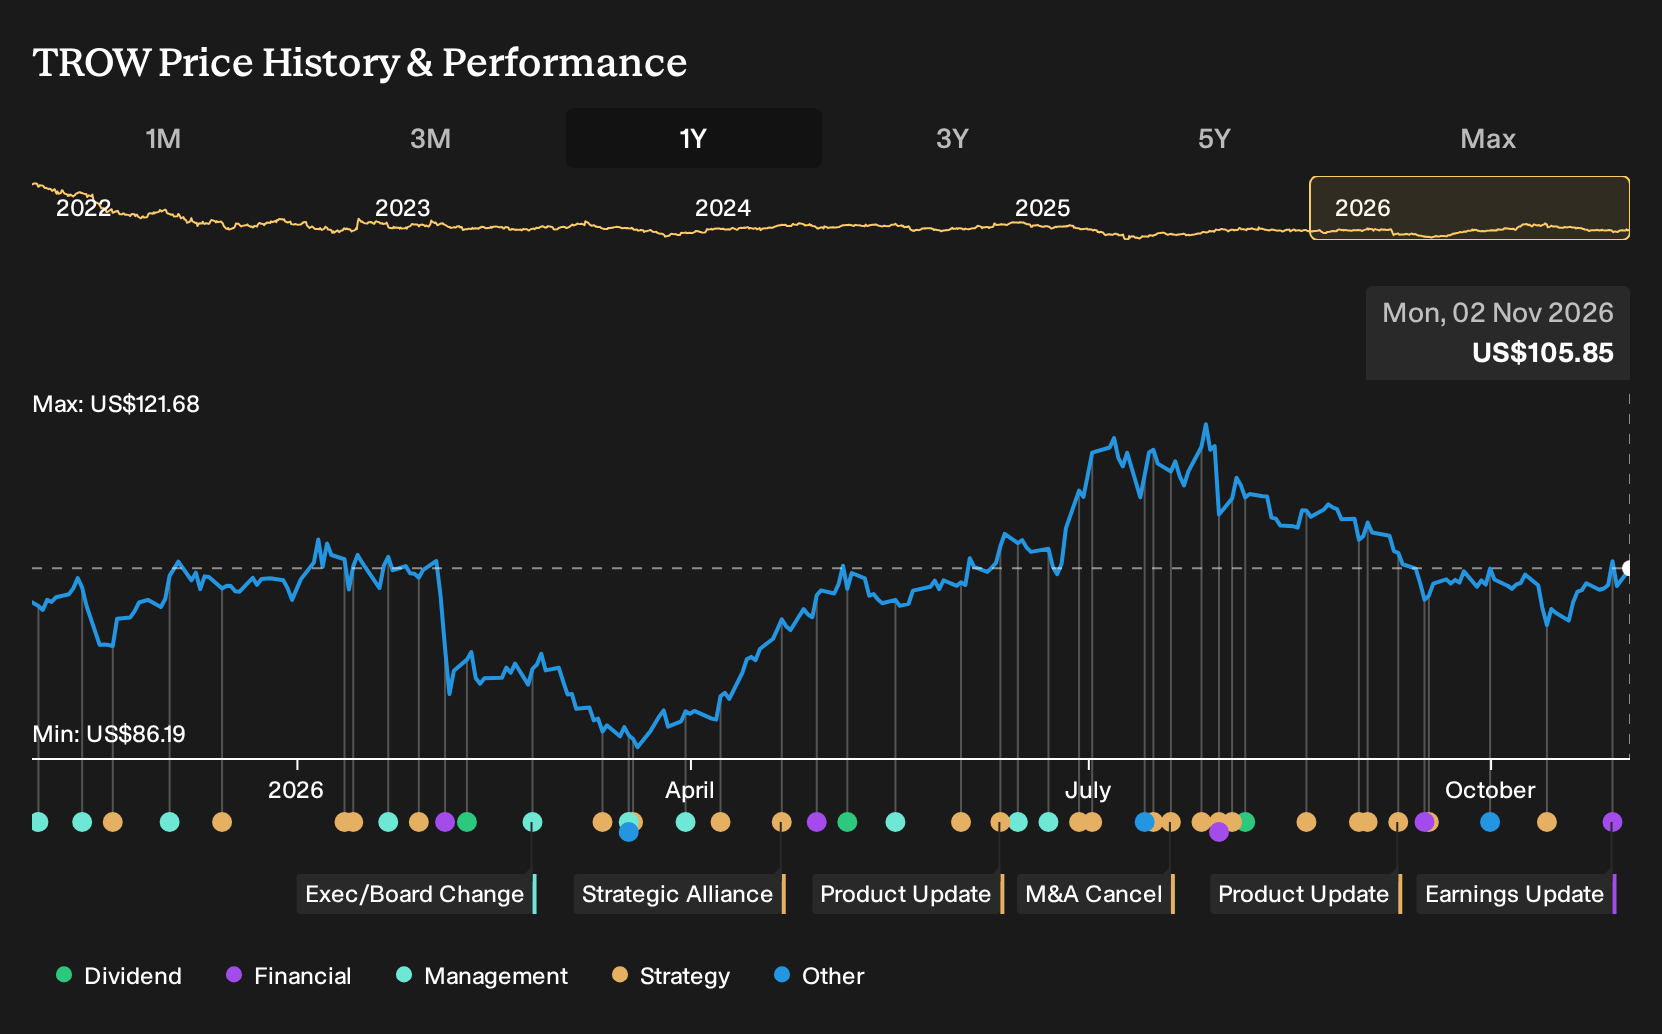
Exploring Other Perspectives
Some of the most optimistic analysts lean hard into T. Rowe Price Group’s AI and ETF build out, arguing that more than 130 AI tools and expectations for revenue of about US$8.5b and earnings of roughly US$2.5b by 2029 could reset the story. You can compare that upbeat view with the latest quarter and decide whether those pre earnings assumptions still feel realistic.
Explore 3 other T. Rowe Price Group fair value estimates, including one that suggests as much as 77% upside from the current price.
Form Your Own Verdict
Don't just follow the ticker. Dig into the data and build a conviction that's truly your own.
- A great starting point for your T. Rowe Price Group research is our analysis highlighting 3 key rewards and 1 important warning sign that could impact your investment decision.
- See our latest analysis for T. Rowe Price Group. The report includes a comprehensive fundamental analysis summarized in a single visual, the Snowflake, making it easy to evaluate T. Rowe Price Group's overall financial health at a glance.
Looking for more investment ideas beyond T. Rowe Price Group?
Once you have a view on T. Rowe Price Group, it can help to widen the lens and see how other businesses stack up on quality, valuation and balance sheet strength using the Simply Wall St Screener.
- If you want potential mispricing combined with resilient fundamentals, scan a curated group of 34 high quality undervalued stocks that meet strict quality and value filters.
- For readers who care most about income stability, focus on a set of 4 dividend fortresses that pair higher yields with durable cash flows.
- When capital preservation is the top priority, start with a 29 resilient stocks with low risk scores that scores well on volatility, leverage and balance sheet robustness.
Have feedback on this article? Concerned about the content? Get in touch with us directly. Alternatively, email editorial-team@simplywallst.com