


EN
Park National (PRK) Posts Stronger Earnings And Dividends, Is The Stock Too Expensive?
How Park National’s latest earnings and dividends set the stage
Park National (PRK) just paired third quarter earnings with fresh dividend news, reporting higher net interest income and net income alongside both a regular and special cash payout that sharpen investor focus on the stock.
Recent trading gives that news some context. The share price jumped 4.24% on the day of the announcement to US$183.02, yet remains down 12.89% over the past 90 days. Total shareholder return over the last 3 years is 87.04%, suggesting long term momentum with shorter term sentiment still catching up to Park National’s latest earnings and dividend signals.
See how Park National’s earnings and dividend profile compares with other resilient financials by reviewing our curated 29 resilient stocks with low risk scores that have been holding up through recent market swings.
After a 4% jump on the results and dividend news, Park National now sits near US$183. The real puzzle is whether that move captured most of the opportunity or only the opening stretch.
Price-to-earnings of 16.5x for Park National: Is it justified?
Park National trades on a P/E of 16.5x against a last close of $183.02, while analysts see the stock only 8.3% below their $199.50 target and internal estimates flag a 28.3% discount to fair value, which sends a mixed message about how generous that earnings multiple really is.
The P/E ratio measures what investors are currently willing to pay for each dollar of profit. For a bank such as Park National, this is often used as a quick shorthand for expectations around future earnings stability, credit quality and interest income resilience rather than rapid expansion.
Context matters here. Park National has grown earnings 5.1% per year over the past 5 years, with the most recent year at 13.6%, and forecasts point to 9.2% annual profit growth from here. Yet the stock carries a richer 16.5x P/E than both the US Banks industry at 11.3x and its peer average at 14.4x. That premium multiple is also above an estimated fair P/E of 12.2x, a level the market could move toward if sentiment cools on the growth outlook.
Explore the SWS fair ratio for Park National.
Result: Price-to-earnings of 16.5x (OVERVALUED)
Still, richer P/E multiples can compress quickly if credit quality weakens or if Park National’s recent net income trend does not hold up.
Find out about the key risks to this Park National narrative.
Another view on Park National’s valuation
The P/E workup presents Park National as expensive, yet the SWS DCF model points in the opposite direction. On that framework, PRK at $183.02 screens as undervalued relative to an estimated future cash flow value of $255.17 per share. This difference creates a wide gap that long term investors need to interpret.
Look into how the SWS DCF model arrives at its fair value.
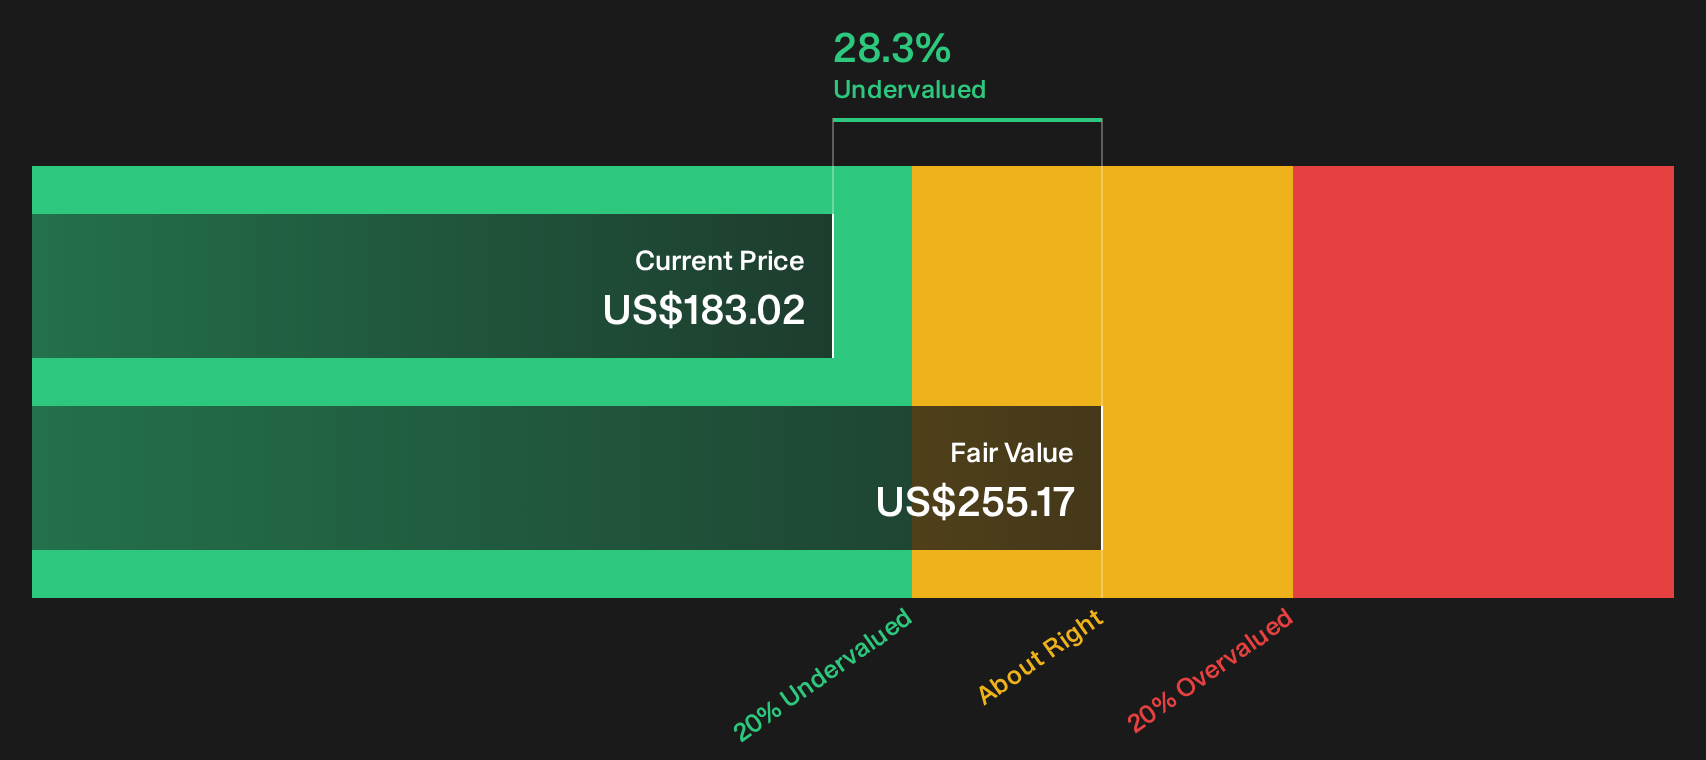
Simply Wall St performs a discounted cash flow (DCF) on every stock in the world every day (check out Park National for example). We show the entire calculation in full. You can track the result in your watchlist or portfolio and be alerted when this changes, or use our stock screener to discover 34 high quality undervalued stocks. If you save a screener we even alert you when new companies match - so you never miss a potential opportunity.
Next Steps
Feeling optimistic about Park National after seeing both the P/E premium and that DCF gap on the table today? Move quickly, test that optimism against the underlying numbers, and pressure test your thesis by reviewing the 4 key rewards
Looking for more investment ideas beyond Park National?
If Park National piqued your interest, do not stop here. Fresh ideas often come from comparing it against other quality stocks surfaced by focused screeners.
- Target steadier returns by scanning a 4 dividend fortresses that focus on income strength and payout resilience alongside balance sheet support.
- Spot potential mispricings by using a 34 high quality undervalued stocks that blend quality fundamentals with discounted valuations.
- Prioritize staying power by filtering a list of solid balance sheet and fundamentals (24 results) where financial footing supports long term compounding potential.
Have feedback on this article? Concerned about the content? Get in touch with us directly. Alternatively, email editorial-team@simplywallst.com