


EN
3 Trading Platform Stocks Worth Watching As Volatility Returns
Volatility has snapped back into focus after Intel’s brutal sell-off, the sector-wide pullback in AI-linked stocks, rising oil prices and a renewed rush into Treasuries. When markets get jumpy, liquidity providers, exchanges and derivatives platforms often feel the impact first, creating both potential pressure points and fresh openings. This article walks through three stocks exposed to these cross-currents and explains why their reaction to the recent news deserves a closer look.
The stocks covered below are just a sample set, and the full screen surfaced 17 more listed platforms with equally compelling narratives that are not shown in this article. To size up that wider universe and quickly identify which exposures fit your own risk tolerance and time horizon, head straight into the Derivatives and Volatility-Linked Trading Platforms screener.
Flow Traders (ENXTAM:FLOW)
Overview: Flow Traders is a financial technology firm that provides liquidity in ETFs and derivatives across asset classes and regions, tying its activity closely to volatility.
Operations: Flow Traders generates about €830 million of revenue from unclassified services tied to its multi asset liquidity provision activities.
Market Cap: €1.0 billion
Flow Traders matters in this screener because it sits where volatility, listed products and liquidity all meet, so market stress can rapidly reshape its opportunity set.
"Expansion of global ETF assets from €6tn in 2019 to €19tn in 2025, with forecasts above €35tn by 2030 and strong non U.S. growth, is expected to give Flow Traders access to a larger pool of trading volumes over time."
What may really move the dial for Flow Traders is how one unresolved cost and capital trade off plays out against that backdrop.
That trade off is the crux of the story, and the full narrative for Flow Traders maps how Flow Traders’ cost base, capital stack and volatility exposure could be quietly decoupling expectations.

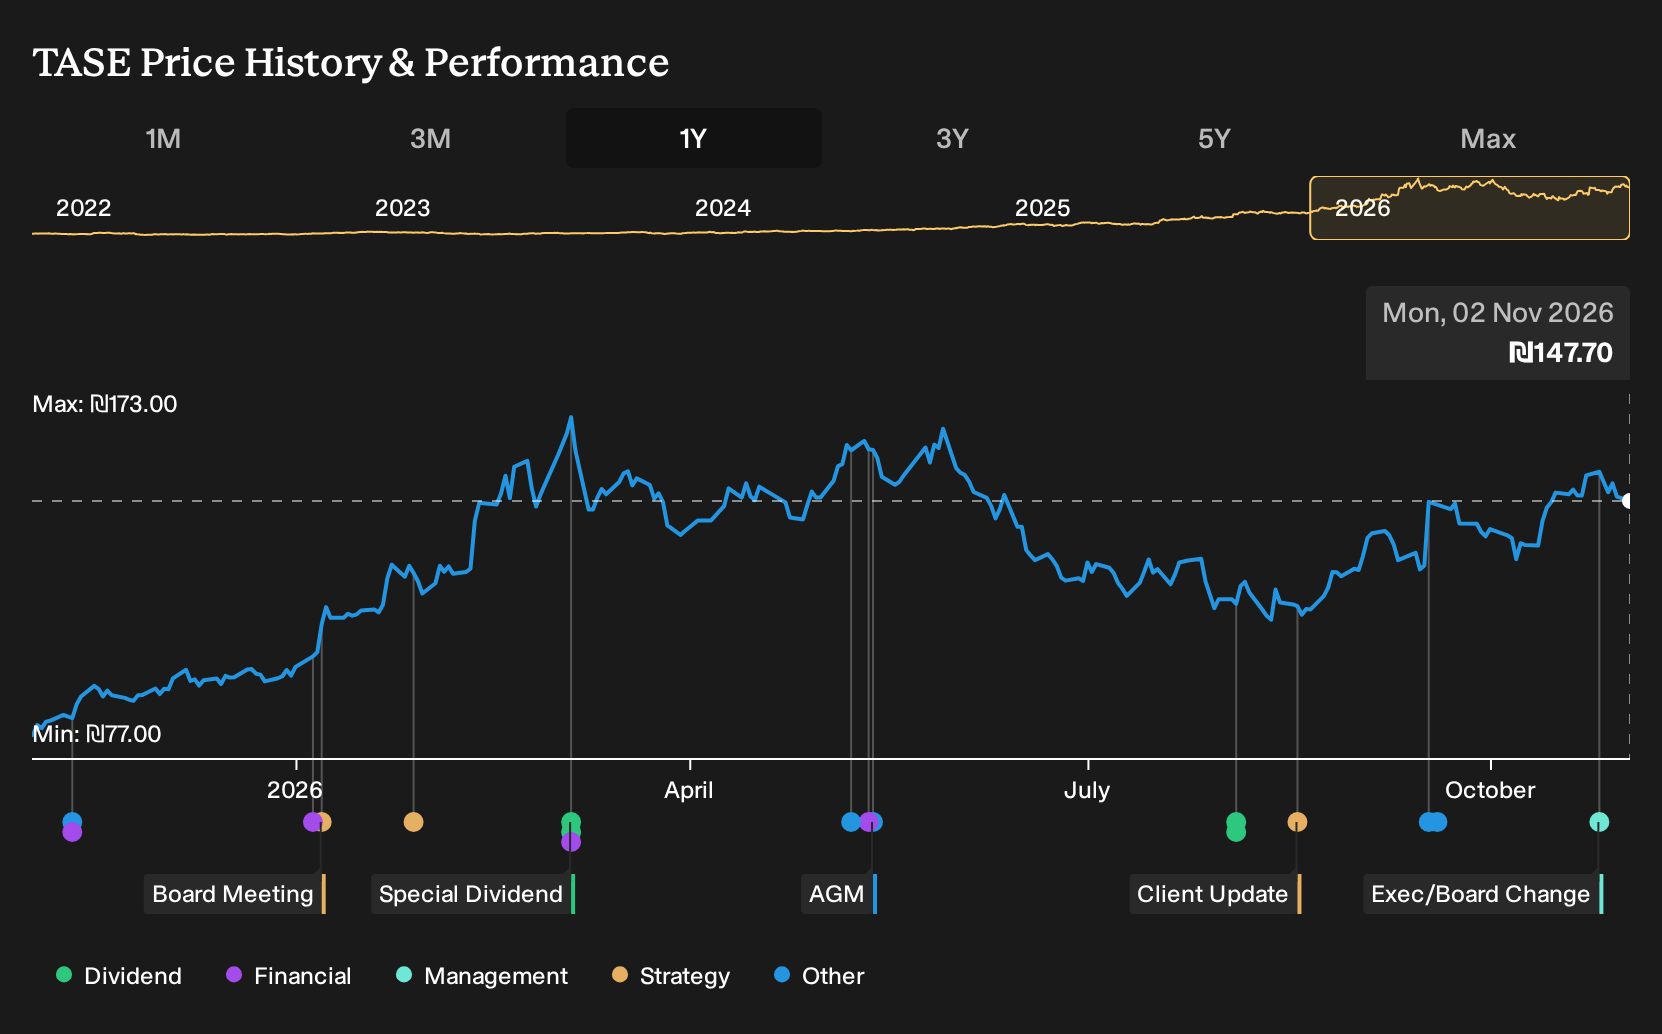
Tel-Aviv Stock Exchange (TASE:TASE)
Overview: Tel-Aviv Stock Exchange runs Israel’s primary securities and derivatives venue, where equities, bonds and listed options change hands each trading day.
Operations: Tel-Aviv Stock Exchange generates ₪665 million from trading and clearing transactions in securities, all sourced from activity within Israel.
Market Cap: ₪13.7b
For this screener, Tel-Aviv Stock Exchange matters because it earns fees on trading and derivatives activity, so risk-off swings that push investors toward options and hedging products can quickly change its revenue mix.
"The shift to a Monday through Friday trading week is increasing access for global participants, which is already linked with higher foreign investor activity and higher average daily volumes. This supports trading and clearing commission revenue and the scalability of earnings."
What really could reshape margins and growth is how one emerging push to expand beyond Israel interacts with volatility driven volumes at home.
That tension between home turf and overseas ambitions is exactly what the full narrative for Tel-Aviv Stock Exchange unpacks. It shows where Tel-Aviv Stock Exchange growth could be accelerating or quietly stalling.
Japan Exchange Group (TSE:8697)
Overview: Japan Exchange Group runs Japan’s main securities and derivatives markets, providing trading venues, data services and self-regulation for listed products.
Operations: Japan Exchange Group generates ¥240,724 million from its Financial Instruments Exchange Business, with all revenue sourced from Japan’s domestic markets.
Market Cap: ¥2.1t
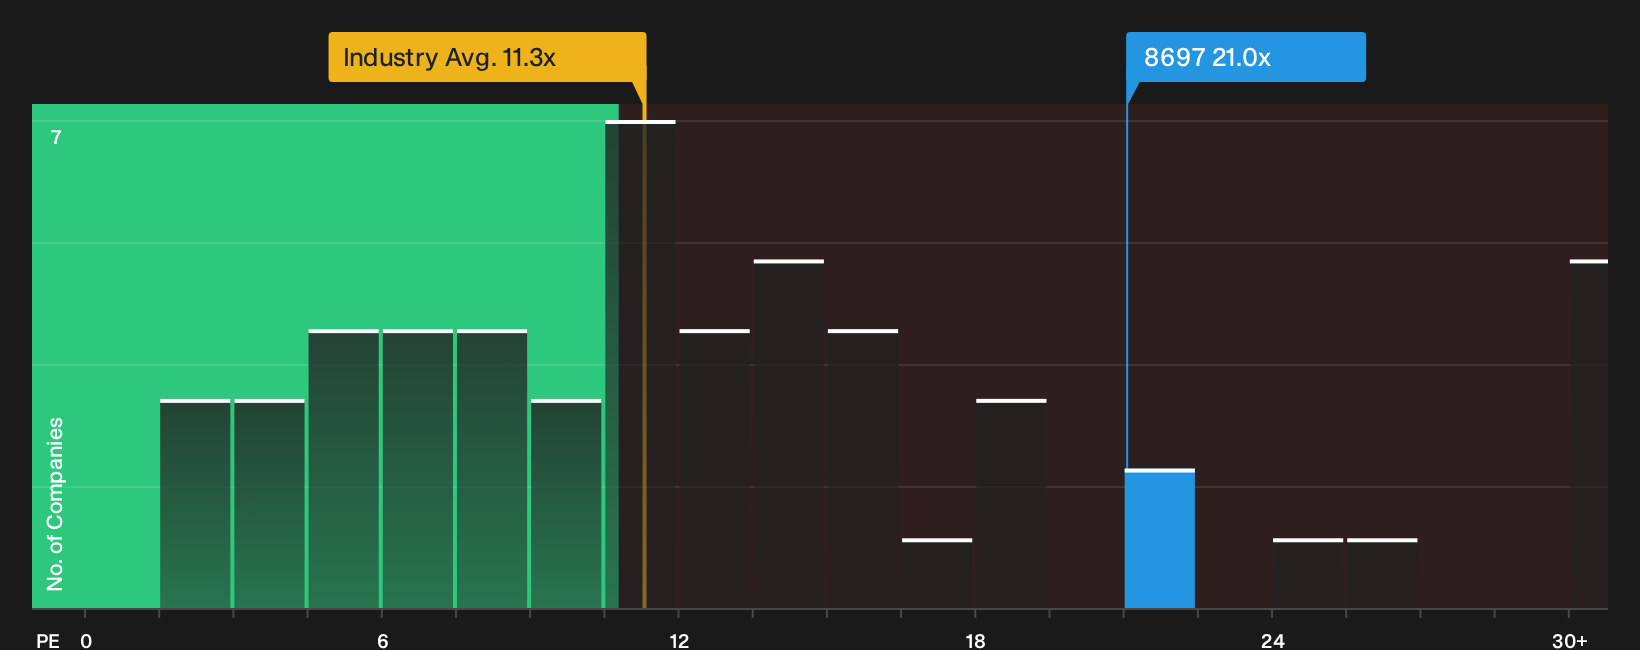
Japan Exchange Group gives you direct exposure to changes in hedging and options activity, since its derivatives and clearing fees are tied to trading volumes when volatility shifts. The stock combines this theme with a rich P/E and high profit margins. As a result, a change in how traders use options to respond to stress could quietly reshape what you pay for that resilience.
That potential shift in what you pay for resilience is exactly what the 4 key rewards and 1 important warning sign is built to unpack, before pricing moves ahead of you.
Seeking Fresh Alternatives Before Crowds?
Fresh opportunities can move from under the radar to fully priced faster than headlines catch up. Screen for potential breakout momentum while it still matters and aim to act early.
- Spot cash generative potential before it gets fully priced by running the 193 high quality undervalued stocks and filtering for balance sheets that can hold up when sentiment turns.
- Explore structural demand for critical materials by checking the 16 top copper producer stocks and focusing on producers that could benefit if supply stays tight.
- Look for income ideas that combine yield with resilience by scanning the 221 dividend fortresses and concentrating on businesses designed to keep paying when markets get rough.
Have feedback on this article? Concerned about the content? Get in touch with us directly. Alternatively, email editorial-team@simplywallst.com