


EN
Universal Display Stock Earnings Beat Has The Bull Case Changed?
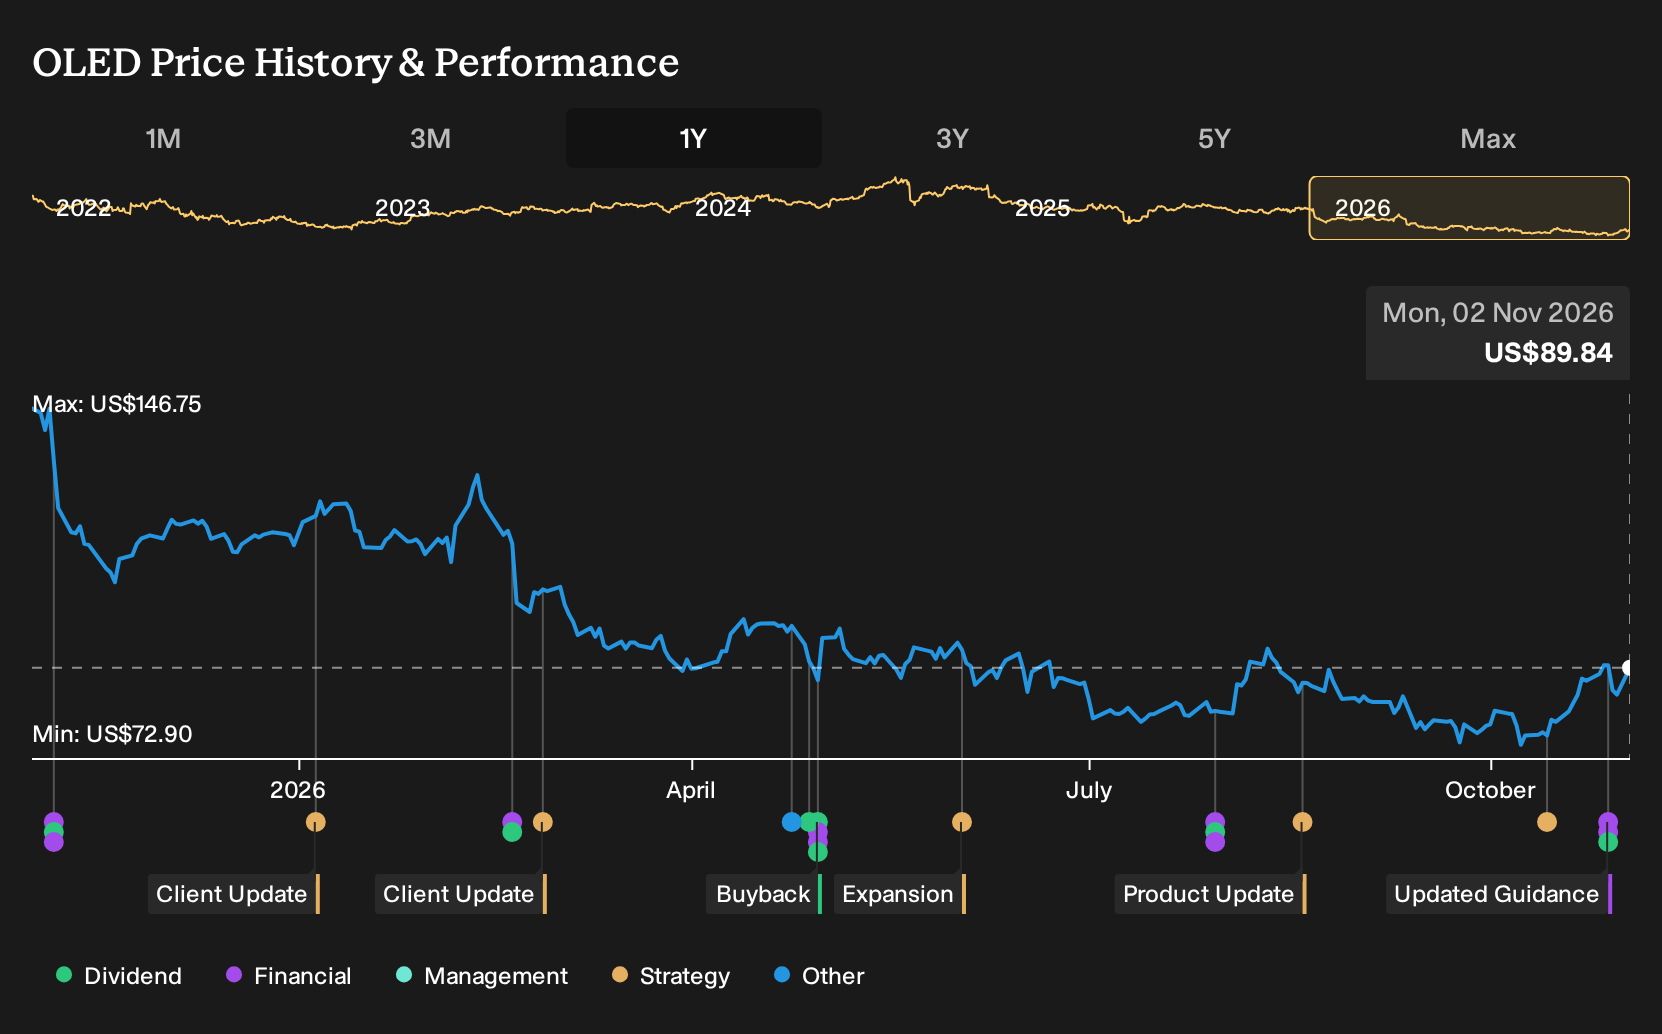
- Universal Display reported third quarter 2026 revenue of US$160.43 million and net income of US$78.95 million, with earnings per share from continuing operations above the prior year, while keeping full year revenue guidance toward the lower end of its US$630 million to US$670 million range.
- The company combined higher third quarter profitability with shareholder returns, affirming a US$0.50 fourth quarter dividend and completing a US$127 million buyback that reduced the share count by 3.22%.
- We will now assess how Universal Display's stronger third quarter profitability could reshape the existing investment narrative around OLED adoption and cash returns.
Scan how Universal Display's mix of profitability, dividends, and buybacks compares with peers by running through our hand picked 4 dividend fortresses.
Universal Display Investment Narrative Recap
To own Universal Display, you need to believe OLED material demand eventually broadens beyond smartphones into IT and automotive, and that the company turns its phosphorescent blue and new architectures into meaningful commercial volume. The latest quarter showed stronger profit, yet full year guidance still points to revenue around the lower end of the US$630 million to US$670 million range.
That mix leaves the key short term catalyst unchanged. You are still watching for steadier material ordering as Gen 8.6 IT fabs ramp and new devices use more Universal Display content. The main risk also stays in focus, with prolonged softness and volatility in handset driven demand that keeps material volumes and earnings choppy.
The most directly relevant update for that story is the confirmed outlook that 2026 revenue should land toward the lower end of the US$630 million to US$670 million band. That guidance ties management expectations to a more cautious read on customer orders despite a strong third quarter income line.
For you as a shareholder, this guidance keeps the nearer term conversation anchored on execution rather than headline growth. It puts more weight on how efficiently Universal Display runs the business, how it manages pricing and costs against uneven demand, and how quickly any pickup from IT and automotive OLED adoption can offset smartphone related swings.
What Analysts Are Building Into Their Universal Display Models
Universal Display's consensus narrative ties the current OLED adoption story to specific numbers. Analysts are assuming revenue rises at roughly 10.0% a year over the next 3 years. On their estimates, earnings today sit at about US$195.6 million and reach US$269.5 million by 2029, with profit margins edging up from 32.2% to 33.4% over that same window.
That earnings path implies an increase of roughly US$73.9 million from current profit levels to the 2029 forecast. The step up is paired with expectations that the share count gradually shrinks, with projected declines of 3.31% per year for the next 3 years. The models also assume investors are willing to pay a P/E of 24.5x on those 2029 earnings, compared with 18.2x today and below the current 49.5x multiple quoted for the broader US semiconductor group.
Universal Display's narrative projects 2029 revenue of US$807.3 million and earnings of US$269.5 million by that year. This requires 10.0% yearly revenue growth and an earnings increase of about US$73.9 million from US$195.6 million today.
Uncover why Universal Display's fair value indicates a 28% potential upside to its current price that could close sooner than you expect.
Exploring Other Perspectives
One alternate view puts more weight on margin risk for Universal Display. The most cautious analysts were assuming revenue of about US$806.9 million and earnings of roughly US$280.3 million by 2029, yet only on a low 13.3x P/E. That is a much more pessimistic story, and this fresh guidance and Q3 beat could eventually reshape it.
Explore 4 other Universal Display fair value estimates, including one that suggests as much as 55% downside from the current price.
The Verdict Is Yours
Disagree with existing narratives? Extraordinary investment returns rarely come from following the herd, so go with your instincts.
- A great starting point for your Universal Display research is our analysis highlighting 4 key rewards and 1 important warning sign that could impact your investment decision.
- See our latest analysis for Universal Display. The report includes a comprehensive fundamental analysis summarized in a single visual, the Snowflake, making it easy to evaluate Universal Display's overall financial health at a glance.
Looking For More Investment Ideas Beyond Universal Display?
If Universal Display has sharpened your focus on profitability, capital returns, and realistic expectations, it can help to compare that story with a wider set of opportunities. The Simply Wall St Screener lets you quickly filter companies by quality, balance sheet strength, income profile, or perceived mispricing so you can build a watchlist that truly matches your approach.
- For investors hunting for what they see as mispriced quality, scan a curated 34 high quality undervalued stocks that some readers may consider worth a closer look.
- If capital preservation and steadier business profiles matter most to you, narrow the field to a 29 resilient stocks with low risk scores that aligns better with your comfort level.
- When you want resilient fundamentals and strong finances to be the starting point, filter the market with a list of solid balance sheet and fundamentals (24 results) that can help you concentrate on companies with robust foundations.
Have feedback on this article? Concerned about the content? Get in touch with us directly. Alternatively, email editorial-team@simplywallst.com