


EN
Douglas Dynamics’s (NYSE:PLOW) Q3 2026 revenue in line with expectations

Snow and ice equipment company Douglas Dynamics (NYSE:PLOW) met Wall Street’s revenue expectations in Q3 2026, with revenue up 34.5% year on year to $218 million. The company’s full-year revenue guidance of $787.5 million at the midpoint came in 1.5% above analysts’ consensus estimates. Its non-GAAP profit of $0.98 per share was 6.2% above analysts’ consensus estimates.
For more on Douglas Dynamics, read our free full research report.
Douglas Dynamics (PLOW) Q3 2026 highlights:
- Revenue $218 million vs S&P analysts’ consensus estimates of $218.6 million (34.5% year-on-year growth, in line)
- Adjusted EPS $0.98 vs S&P analysts’ consensus estimates of $0.92 (6.2% beat)
- Adjusted EBITDA $37.94 million vs analysts’ consensus estimates of $34.77 million (17.4% margin, 9.1% beat)
- Revenue guidance The company slightly lifted its revenue guidance for the full year to $787.5 million at the midpoint from $785 million
- Adjusted EPS guidance Management raised its full-year adjusted EPS guidance to $3.20 at the midpoint, a 1.6% increase
- EBITDA guidance $129 million at the midpoint for the full year, above analysts’ consensus estimates of $125.3 million
- Operating margin 14.3%, up from 8.7% in the same quarter last year
- Free cash flow -$26.23 million compared to -$11.45 million in the same quarter last year
- Market capitalization $920.1 million
Mark Van Genderen, President & CEO, noted, "The business results our team has delivered through the first nine months of the year is exceptional and demonstrates the earnings power of our business and the effectiveness of the strategic actions we have taken over the past several years. Our operational execution remains strong, and while we wait for winter to begin, we believe we are well positioned to continue advancing our strategic initiatives."
Revenue growth
Examining a company’s long-term performance can provide clues about its quality. Any business can experience short-term success, but top-performing ones enjoy sustained growth for years. Over the last five years, Douglas Dynamics grew its revenue at a mediocre 6.7% compounded annual growth rate, falling short of the rest of the industrials sector. Still, there are things to like about Douglas Dynamics.
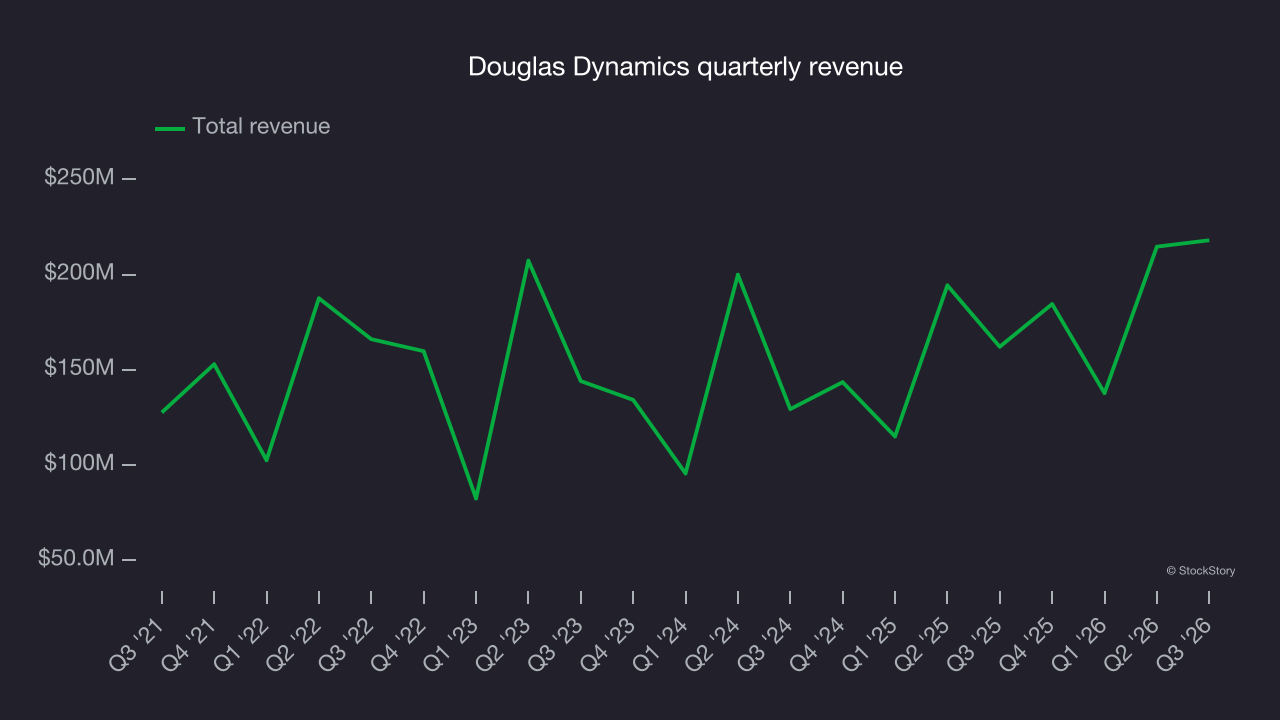
Long-term growth matters most, but within industrials, a half-decade historical view may miss cycles, industry trends or a company capitalizing on catalysts such as a new contract win or a successful product line. Douglas Dynamics’s annualized revenue growth of 16.2% over the last two years is above its five-year trend, suggesting its demand recently accelerated. 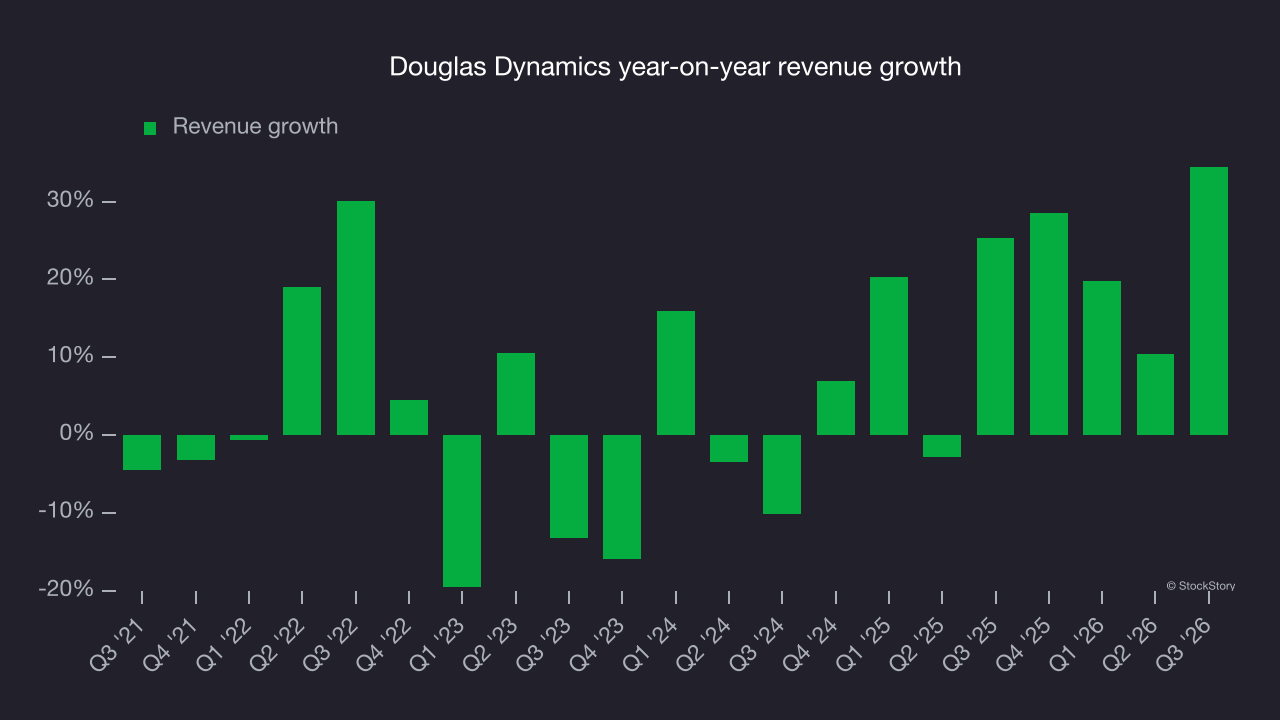
This quarter, Douglas Dynamics’s year-on-year revenue growth of 34.5% was strong, and its $218 million of revenue was in line with Wall Street’s consensus estimates.
Looking ahead, sell-side analysts expect revenue to grow 6.5% over the next 12 months, according to S&P, a deceleration versus the last two years. This projection is underwhelming and implies its products and services will face some demand challenges. At least the company is tracking well in other measures of financial health.
Operating margin
Operating margin is an important measure of profitability as it shows the portion of revenue left after accounting for all core expenses, from the cost of goods sold to advertising and wages. It’s also useful for comparing profitability across companies with different levels of debt and tax rates because it excludes interest and taxes.
Douglas Dynamics has managed its cost base well over the last five years. It demonstrated solid profitability for an industrials business, producing an average operating margin of 10.1%. This result was particularly impressive given its low gross margin, which is mostly a factor of what it sells and requires substantial shifts to change meaningfully. Companies have more control over their operating margins, and high operating margins alongside low gross margins indicate well-managed operations.
Analyzing the trend in its profitability, Douglas Dynamics’s operating margin rose by 3.5 percentage points over the last five years, as its revenue growth gave it operating leverage. Its expansion shows it’s one of the better heavy transportation equipment companies as most peers saw their margins decline.
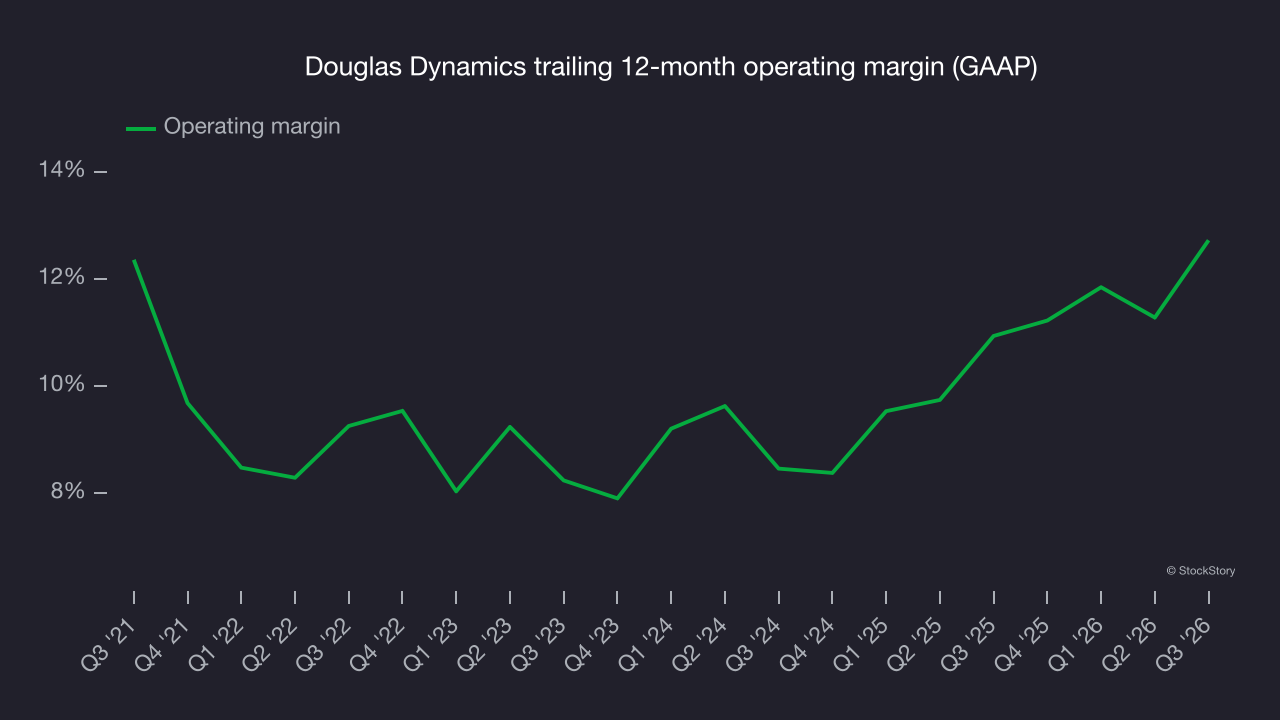
This quarter, Douglas Dynamics generated an operating margin of 14.3%, an increase of 5.7 percentage points year on year. The increase was solid, and its operating margin rose more than its gross margin, suggesting greater efficiency in expenses such as marketing, research and development and administrative overhead.
Earnings per share
Revenue trends explain a company’s historical growth, but the long-term change in earnings per share, or EPS, points to the profitability of that growth. For example, a company could inflate its revenue through excessive spending on advertising and promotions.
Douglas Dynamics’s EPS grew at a 9.5% compounded annual growth rate over the last five years, higher than its 6.7% annualized revenue growth. This indicates the company became more profitable on a per-share basis as it expanded.
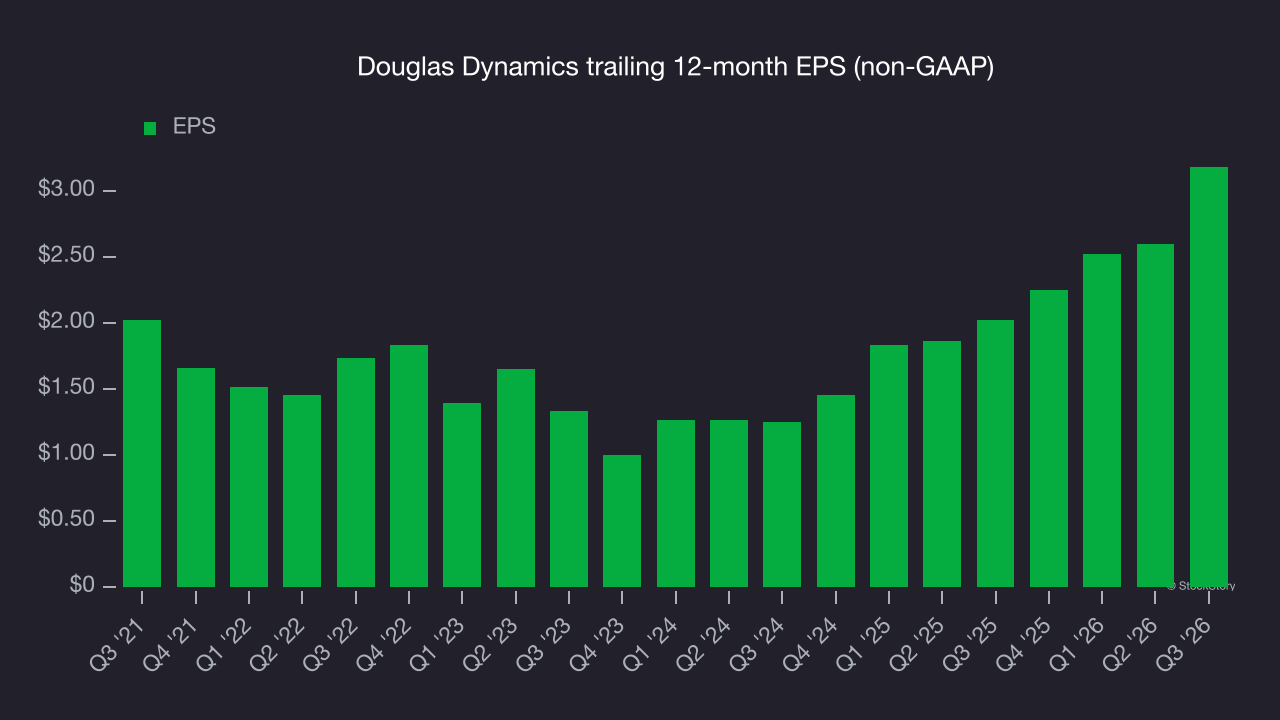
A closer look at Douglas Dynamics’s earnings quality helps explain the drivers of its performance. As mentioned earlier, Douglas Dynamics’s operating margin expanded by 3.5 percentage points over the last five years. This was the most relevant factor, aside from the revenue impact, behind its higher earnings; interest expenses and taxes can also affect EPS but don’t tell us as much about a company’s fundamentals.
As with revenue, examining EPS over a more recent period can provide insight into an emerging theme or development for the business.
For Douglas Dynamics, its two-year annual EPS growth of 59.5% was higher than its five-year trend. This acceleration made it one of the faster-growing industrials companies in recent history.
In Q3, Douglas Dynamics reported adjusted EPS of $0.98, up from $0.40 in the same quarter last year. This result beat analysts’ consensus estimates by 6.2%. Over the next 12 months, Wall Street expects Douglas Dynamics’s full-year EPS to grow 3.6% from $3.18 to $3.29, according to S&P.
Key takeaways from Douglas Dynamics’s Q3 results
A sizable beat on EBITDA and full-year EBITDA guidance above Wall Street’s consensus estimates gave Douglas Dynamics’s Q3 report some important positives. Revenue, however, was in line with expectations. Investors were likely hoping for more, as shares fell 3.5% to $38.43 immediately after the results.
To assess whether Douglas Dynamics is an attractive buy at the current price, the latest quarter is only one part of its longer-term business quality. Quality, combined with valuation, can help determine whether the stock is a buy. For more, read our full research report here (it’s free).