


EN
Kerui: Seasonal decline after the Golden Nine Pulse, the new supply area for newly built commercial housing in 50 key cities across the country fell by 64.1% month-on-month in October
The Zhitong Finance App learned that on November 2, Kerui Real Estate Research released the National Real Estate Market Research Report for October 2026. In October 2026, the new supply area for newly built commercial housing in 50 key cities across the country was about 5.65 million square meters, a year-on-month decrease of 64.1%, a year-on-year decrease of 26.8%, and an increase of 23.5 percentage points over the previous month. After the “Golden Nine” volume was concentrated, the supply side declined rapidly, and the monthly scale fell again to the low to medium range during the year. The cumulative supply area from January to October was about 83.45 million square meters, a cumulative year-on-year decrease of 19.5%, an increase of 0.6 percentage points over the previous September. Overall, supply in October switched from “active volume release” in September to a “high decline”, and the pace of forensic promotion was repeated over and over again, reflecting that the supply flexibility of housing enterprises was still limited under sales repayment and capital constraints, and the supply contraction trend did not change throughout the year under the influence of the “sales to determine production” logic.
Policy environment: Stock improvement and interest rate reduction have become the main line, and local “828 New Deal” implementation rules have been implemented intensively
In October 2026, while continuing the moderately relaxed tone of the national real estate policy, the focus changed from “laying the foundation for the system” to “implementing rules, improving stock quality, and supporting demand”. The central level focuses on the renovation of factory areas in old neighborhoods, formal implementation of interest rate discounts on home purchase loans, monetary credit stabilization, and family housing support; the “828 New Deal” implementation rules have been intensively expanded at the local level, and cities such as Wuhan, Shenzhen, Tianjin, Hangzhou, Ningbo, Suzhou, and Shiyan, Chengdu, Hefei, Wenzhou, and Changsha have followed suit. The expansion of the provident fund scenario, housing purchase subsidies, housing ticket placement, housing “trade-in”, and “good house” construction are progressing simultaneously.
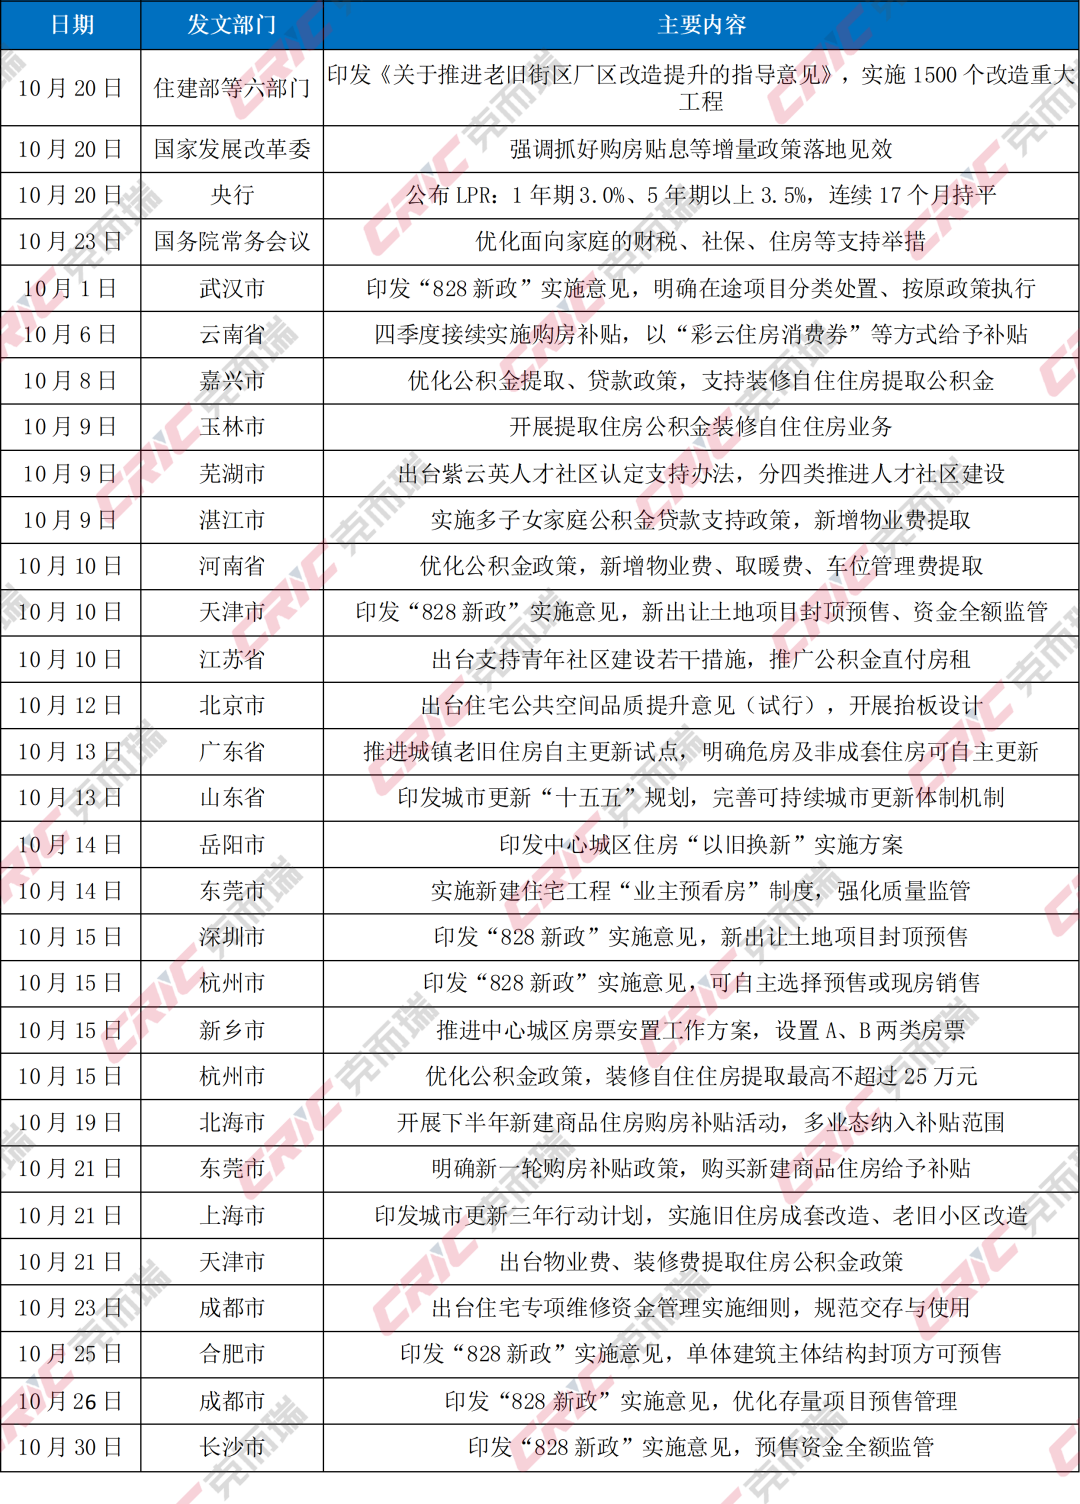
On the central side, the October policy showed the characteristics of “improving stock quality, implementing interest rates, and accepting the system.” First, urban renewal and inventory renovation and refinement. Six departments including the Ministry of Housing and Construction issued the “Guiding Opinions on Promoting Factory Renovation and Upgrading of Old Neighborhoods”, which clearly and orderly implement 1,500 major projects for factory area renovation and upgrading in an orderly manner; second, monetary credit remained stable, with a 1-year LPR of 3.0% and 3.5% for a period of 5 years or more, which remained flat for 17 consecutive months. Funding was relaxed, but total investment placed more emphasis on precise adjustment; third, interest rates on home purchase loans were officially implemented on October 1, and annual personal housing loans were granted for eligible new commercial housing loans. 1 percentage point, up to 5 years of finance Interest rates are discounted. The National Development and Reform Commission emphasized implementing incremental policies to achieve results; fourth, the National Standing Committee proposed measures to optimize fiscal, social security, housing, etc. for families, and the housing policy was further integrated into the framework of household support and high-quality population development; fifth, the central bank sent a signal of deepening interest rate marketization at the Financial Street Forum, and overnight repurchase interest rates will gradually become the main policy interest rate.
At the local level, 56 regulatory policies were introduced in October, 52 loose policies are absolutely dominant, 1 neutral policy, and 3 austerity policies. The core of the implementation rules of the “828 New Deal” revolves around priority existing housing sales for new land concessions, full supervision of pre-sale funds, and the transition of host banking systems and project classification transitions; the provident fund reform shifts from “withdrawal” to “scenario expansion+mutual assistance for families with many children + national mutual recognition from other places”, and decoration, property fees, heating fees, concession tax, and parking space extraction have become new businesses implemented centrally in many places; Yunnan, Dongguan, Beihai, Yueyang, Xinxiang, etc. Housing ticket placement and promotion of housing “trade-in”; supply-side urban renewal enters the “15th Five-Year Plan” During the intensive implementation phase, Shandong, Shanghai, Guangdong, Xi'an and other places successively introduced renewal plans or pilot programs for independent renewal; austerity policies mainly involved maintenance fund supervision, housing verification, and project quality forecasting.
By the end of October 2026, 17 cities had issued the “828 New Deal” implementation rules, which generally showed the characteristics of “uniform bottom line, parameter differentiation, transition flexibility, and city-specific policies.” Among them, they are all divided between the old and new on August 28. Pre-sale of new land plots requires the principal to be capped, the entire pre-sale capital is supervised, and loaned after the mortgage is completed; the difference is mainly that the maximum deposit limit for existing housing sales forms three levels of 1%, 3%, and 5%. The capping certification ranges from “roof pouring” to “five-party inspection+on-site inspection”. Land payments are split over two years, “1+1” and interest-free; the transition period is mostly at the end of 2027, Wuhan, Hangzhou, and Ningbo until the end of 2028, and Hefei. There is no uniform deadline for historical heritage projects; the degree of policy tightness mainly depends on commercial housing inventory and land market fundamentals noodles, etc.
Table 1. Typical central and local real estate-related policies in October 2026
Data source: CRIC.
New housing supply: Seasonal decline after the Golden Nine Pulse, down 64.1% month-on-month and widened year-on-year decline. The cumulative year-on-year decline increased to 19.5% in the first 10 months
In October 2026, the new supply area for newly built commercial housing in 50 key cities across the country was about 5.65 million square meters, a year-on-month decrease of 64.1%, a year-on-year decrease of 26.8%, and an increase of 23.5 percentage points over the previous month. After the “Golden Nine” volume was concentrated, the supply side declined rapidly, and the monthly scale fell again to the low to medium range during the year. The cumulative supply area from January to October was about 83.45 million square meters, a cumulative year-on-year decrease of 19.5%, an increase of 0.6 percentage points over the previous September. Overall, supply in October switched from “active volume release” in September to a “high decline”, and the pace of forensic promotion was repeated over and over again, reflecting that the supply flexibility of housing enterprises was still limited under sales repayment and capital constraints, and the supply contraction trend did not change throughout the year under the influence of the “sales to determine production” logic.
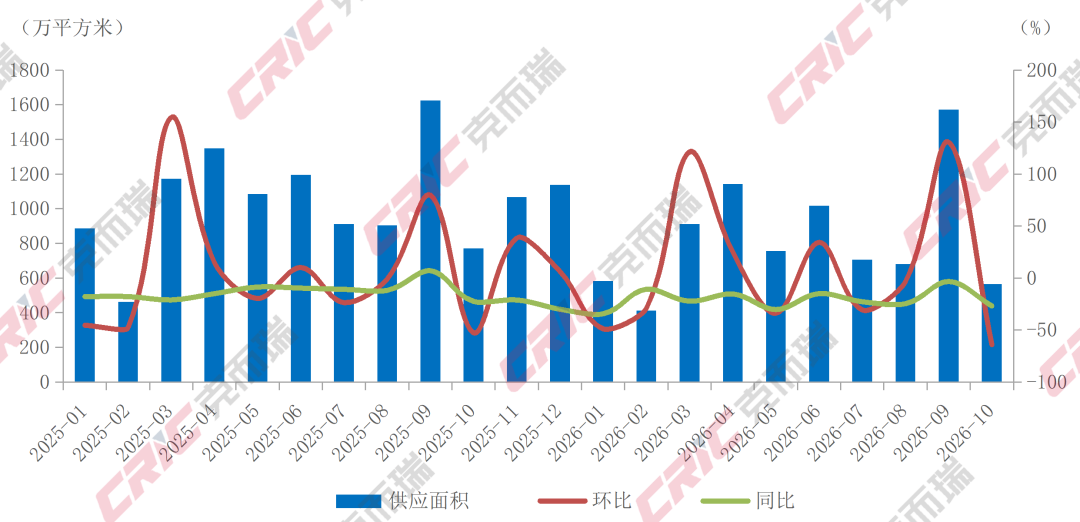
Figure 1 Changes in the monthly new supply area of newly built commercial housing in 50 key cities across the country from January 2025 to October 2026
Data source: CRIC China Real Estate Decision Consulting System
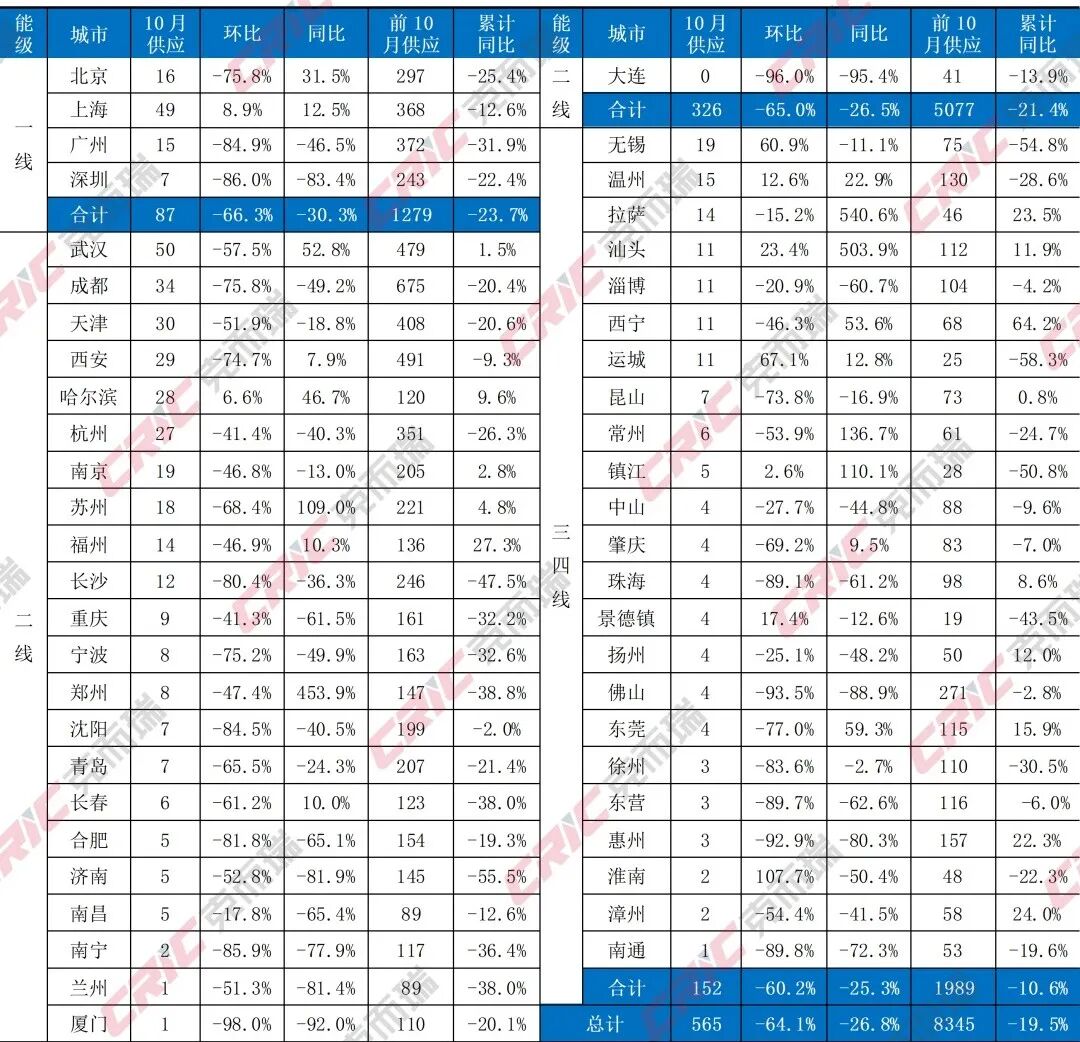
Judging from the performance of cities at various energy levels, the four first-tier cities supplied about 870,000 square meters in October, down 66.3% from the previous year. The cumulative supply in the first 10 months was 12.79 million square meters, down 23.7% year on year, the cumulative decline was the highest among all energy levels; 23 second-tier cities supplied about 3.26 million square meters, down 65.0% from the previous month and 26.5% year on year; the total supply of 50.77 million square meters in the previous 10 months, down 21.4% year on year; 23 third- and fourth-tier cities supplied about 1.52 million square meters, down 60.2% year on year, down 60.2% year on year. 25.3%, with a cumulative supply of 1.89 million square meters in the first 10 months, a cumulative year-on-year decrease of 10.6%, the smallest cumulative decline among all energy levels. Overall, supply in October shifted from “full release” in September to a “general contraction”. Only a few low base cities maintained positive growth, and the weak supply-side pattern was once again highlighted.
Table 2. Supply area of newly built commercial housing in 50 key cities across the country in October 2026 (unit: 10,000 square meters)
Data source: CRIC China Real Estate Decision Consulting System
Note: The October data is estimated from the previous 27 days, and there may be some deviations from the actual data.
New home transactions: Positive growth for two consecutive months, but momentum has slowed, and the year-on-year decline narrowed to 12.0%. The cumulative year-on-year decline in the previous 10 months was still 10.7% year-on-year
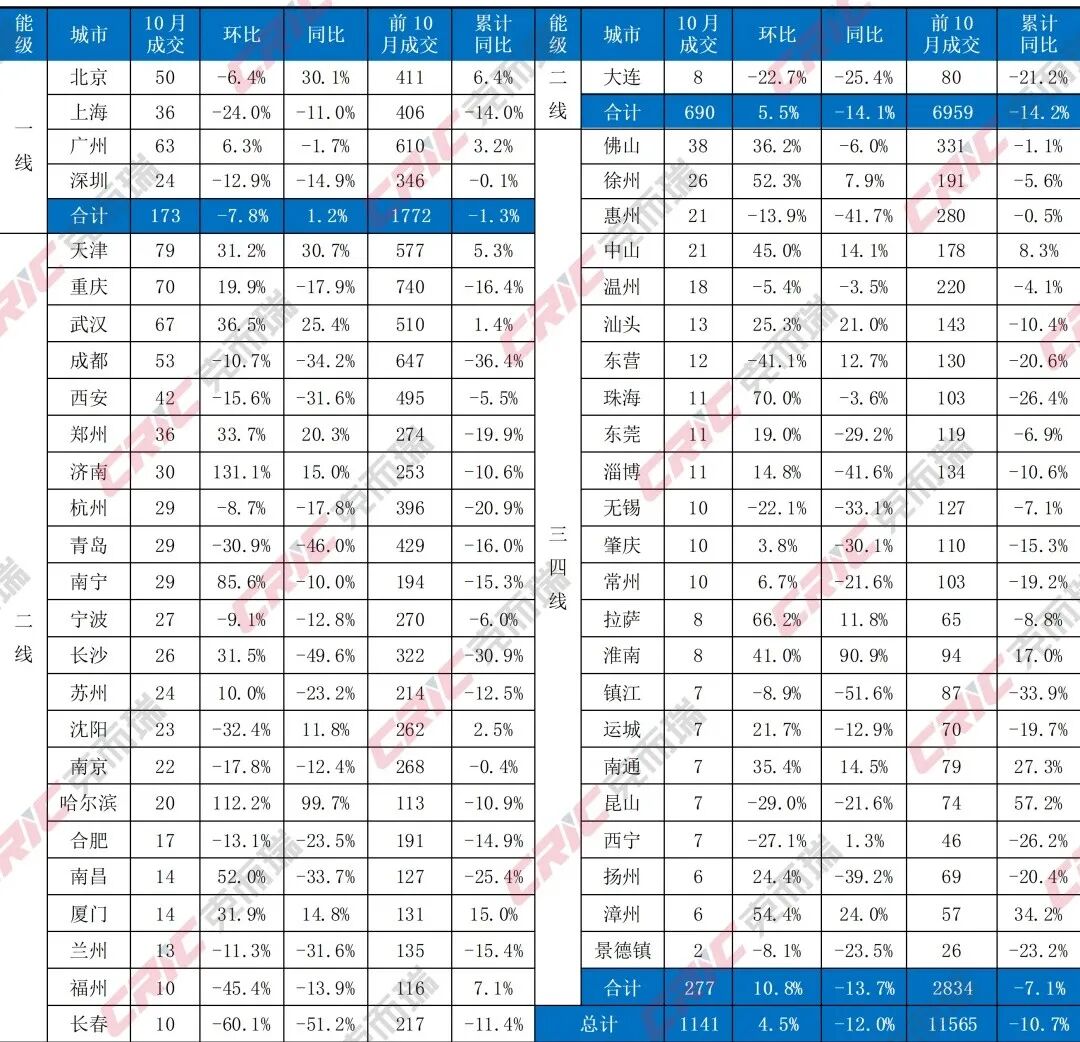
In October 2026, the transaction area of newly built commercial housing in 50 key cities across the country was about 11.41 million square meters, up 4.5% month-on-month. The growth rate declined 6.1 percentage points in October and September; the year-on-year decline was still 12.0%, but the decline was 2.2 percentage points narrower than the previous month, and the monthly transaction scale reached a new high of nearly three months. The cumulative transaction area from January to October was about 115.65 million square meters, a cumulative year-on-year decrease of 10.7%. The decline was basically the same as in the previous 9 months. Overall, the steady recovery in transactions in October was mainly supported by volume from second-tier and third-tier and fourth-tier cities, compounded by stock removal in the context of supply contraction and the “Silver Ten” promotion window. The characteristics of the bottom of the market were evident; however, it will still take time for demand confidence to recover, and the continuation of the recovery in transactions remains to be seen.
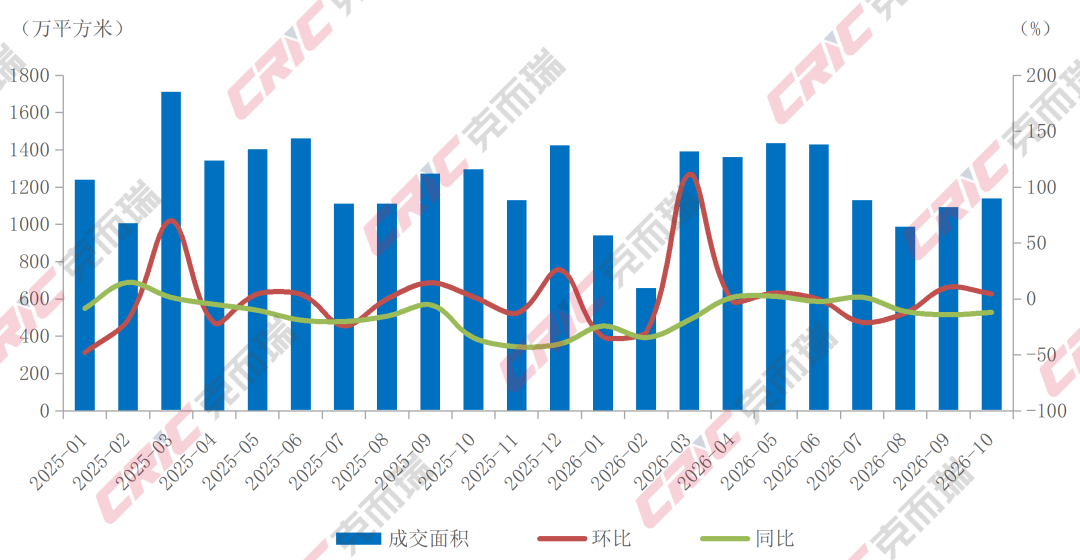
Figure 2 Monthly changes in the transaction area of newly built commercial housing in 50 key cities across the country from January 2025 to October 2026
Data source: CRIC China Real Estate Decision Consulting System
Judging from the performance of cities at various energy levels, the four first-tier cities traded about 1.73 million square meters in October, down 7.8% month-on-month and 1.2% year-on-year; cumulative sales in the first 10 months were 17.72 million square meters, down 1.3% year-on-year, the cumulative decline was the smallest at all energy levels; 23 second-tier cities traded about 6.9 million square meters, up 5.5% month-on-month and 14.1% year-on-year; 23 third- and fourth-tier cities traded about 2.77 million square meters, up 10.8% month-on-month and 13.7 year-on-year down %. Cumulative transactions of 28.34 million square meters in the first 10 months, a cumulative year-on-year decrease of 7.1%. Trends at various energy levels are clearly divided: the first tier was the only positive year-on-year increase (1.2% increase), but the month-on-month decline reflected the decline in kinetic energy after the release of the backlog of demand in core cities in the early stages; the second-tier and third-tier levels rebounded month-on-month but still fell by more than 13% year over year, and the color and breadth of the recovery was still limited.
Table 3. Transaction area of newly built commercial housing in 50 key cities across the country in October 2026 (unit: 10,000 square meters)
Data source: CRIC China Real Estate Decision Consulting System
Note: The October data is estimated from the previous 27 days, and there may be some deviations from the actual data.
Second-hand housing transactions: The month-on-month increase changed from decline to increase, and the year-on-year increase rose to 20.4%. The cumulative year-on-year increase in the previous 10 months was 7.6%
In October 2026, the second-hand housing transaction area in the country's 20 key cities was about 14.61 million square meters, up 3.0% month-on-month, ending a five-month month-on-month decline, and the monthly turnover level recovered slightly; the year-on-year increase was 20.4%, and the growth rate rebounded sharply by 16.9 percentage points from the previous month, mainly affected by the low base for the same period last year, and the actual transaction scale was still at the middle level during the year. The cumulative transaction area in the first 10 months was about 153.8 million square meters, up 7.6% year on year, and 1.2 percentage points higher than in the previous September. Compared with the 12.0% year-on-year decline in new housing, the resilience of second-hand transactions is prominent. In October, the scale of second-hand transactions was about 1.3 times that of new homes, and the pattern of “one second-hand differentiation and stock dominance” was further strengthened.
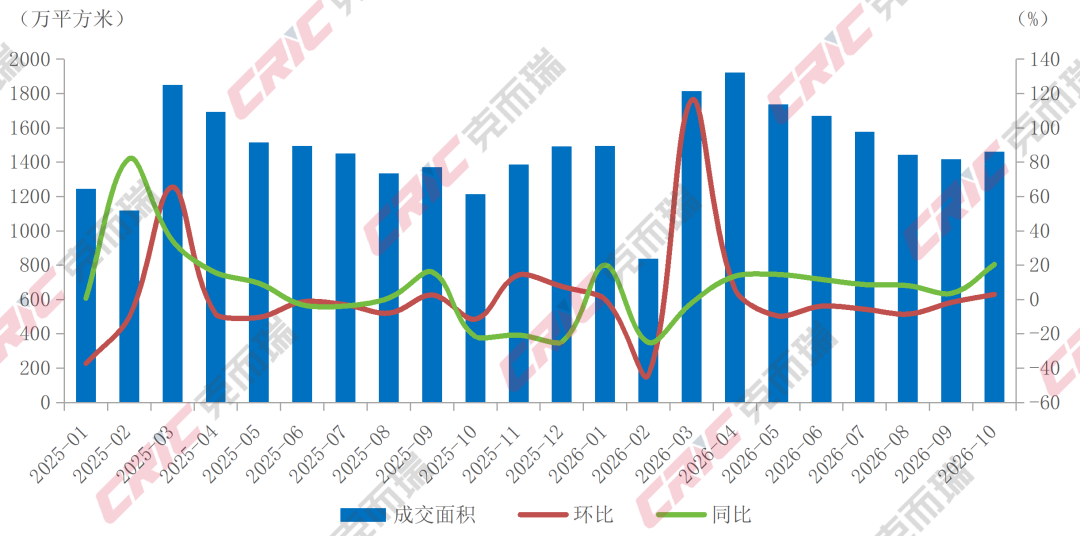
Figure 3 Changes in monthly second-hand housing transaction area in 20 key national cities from January 2025 to October 2026
Data source: CRIC China Real Estate Decision Consulting System
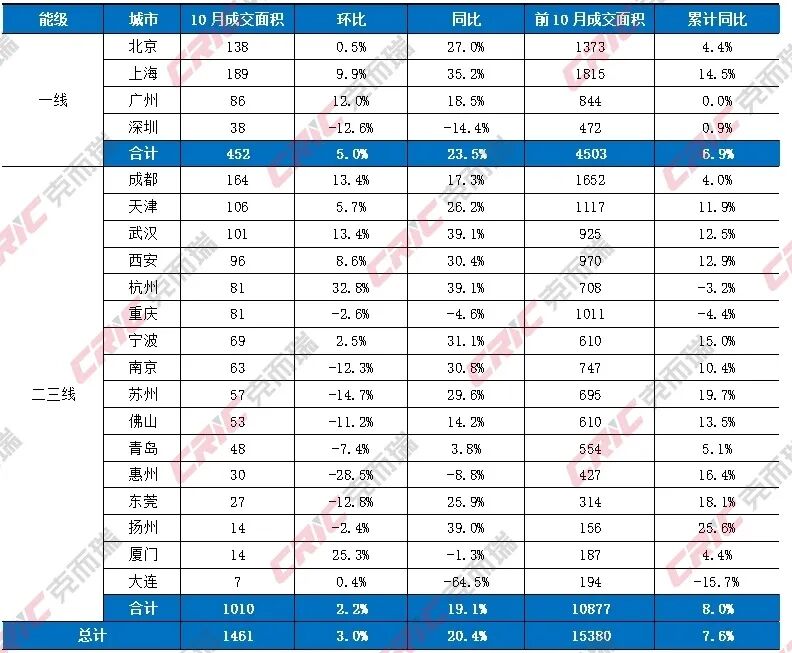
Judging from the performance of cities at various energy levels, second-hand housing transactions in first-tier cities in October were about 4.52 million square meters, up 5.0% month-on-month and 23.5% year-on-year. The cumulative transaction rate in the first 10 months was 4.53 million square meters, with a cumulative year-on-year increase of 6.9%, and the year-on-month growth rate was higher than the overall average; second- and third-tier cities traded about 10.1 million square meters in October, with a cumulative year-on-year increase of 8.0%, reflecting a full price correction in core second-tier and third-tier cities After that, the release of immediate demand and demand for improvement was more flexible.
Looking at the transaction scale of key cities, in October, Shanghai ranked first in the country with 1.892,700 square meters, up 9.9% month-on-month and 35.2% year-on-year growth, ranking first among first-tier cities; Chengdu ranked second with 1,6393 million square meters, up 13.4% month-on-month and 17.3% year-on-year, maintaining a high level of operation for many months; Beijing ranked third with 1.383,700 square meters, a slight increase of 0.5% over the previous year; Tianjin, Wuhan, and Xi'an all had monthly transactions of more than 950,000 square meters, with a year-on-year increase of 39.1% , Hangzhou had a sharp increase of 32.8% month-on-month, with the highest growth rate; Chongqing traded 810,000 square meters, a slight decrease of 2.6% month-on-month and 4.6% year-on-year, and the thermal differentiation between cities is still significant.
Table 4 Second-hand housing transaction area in 20 key national cities in October 2026 (unit: 10,000 square meters)
Data source: CRIC China Real Estate Decision Consulting System
Note: The October data is estimated from the previous 27 days, and there may be some deviations from the actual data.
Land market: The popularity of land auctions fell to a low level in October, and the premium rate fell back to 1.01%
In October 2026, the supply side of the land market declined rapidly after centralized sales in September. Despite month-on-month sales, the average price and premium rate declined simultaneously. The definitive value of high-quality land plots in core cities was still recognized by capital. According to Kerui data, the land supply area of the 50 key cities was 9.44,700 square meters, down 80.50% from the previous year; the construction area was 18.075,500 square meters, up 26.70% from the previous year, up 21.30% year on year; the transaction amount was 102,334 billion yuan, down 15.00% month on month, down 0.50% year on year; the transaction floor price was about 5,662 yuan/square meter, down 32.90% month on month, down 18.00% year on year.
Judging from market popularity, the average premium rate fell back to 1.01% this month, a sharp drop of 6.95 percentage points from September and 2.19 percentage points from the same period last year, the lowest level in a single month since 2025. High total price plots are concentrated in core cities such as Xiamen and Guangzhou. Single parcels of land in Xiamen's Siming District topped the total price list with 4.879 billion yuan, while land in Guangzhou's Huangpu district became the only premium transaction among high total price plots with a premium rate of 26.61%; Nantong (15.78 billion yuan), Changzhou (14.796 billion yuan), and Nanjing (14.228 billion yuan) ranked in the top three in total transaction prices with low unit prices and large land plots. The auction rate fell back to 1.08%, which is at a relatively low level in history. Housing companies' bids have completely turned cautious, and bottom price transactions have become absolutely mainstream.
The performance of cities at various energy levels is clearly divided. On the supply side, among the first-tier cities, Beijing had the highest construction area of about 334,500 square meters, Shenzhen had no new supply during the month, and the scarcity of land supply in core cities increased; among second-tier cities, Wuhan ranked first in the country in terms of supply of about 2,188 million square meters, while Chongqing (1,508 million square meters), Nanchang (592,100 square meters), and Xi'an (539,000 square meters) also stand out; Among the third- and fourth-tier cities, Foshan ranked first with 1,224,600 square meters, but most cities had a low land supply position. On the transaction side, Zhenjiang ranked first with 2.6918 million square meters of construction, and Jiangsu cities such as Nantong, Nanjing, and Changzhou had significant sales volume; Xiamen had the highest average transaction price of about 22,812 yuan/square meter, and Guangzhou (2,1738 yuan/square meter) ranked second. The value of high-quality land in the core city continued to stand out.
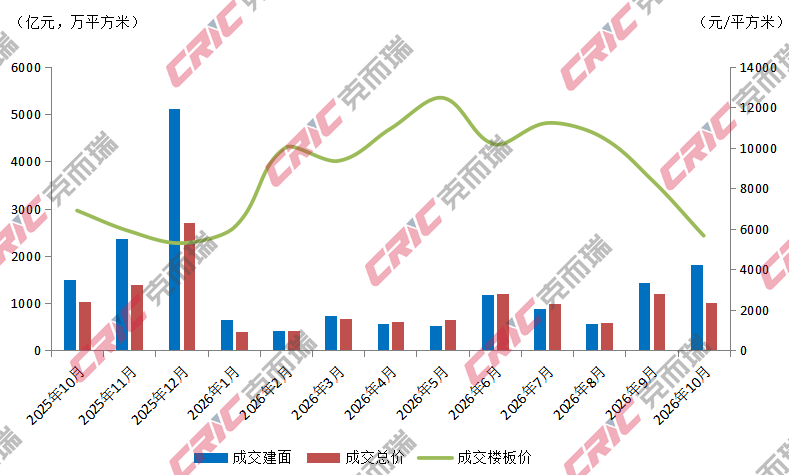
Figure 4 Monthly residential land transactions in 50 key cities from October 2025 to October 2026
Data source: CRIC China Real Estate Decision Consulting System
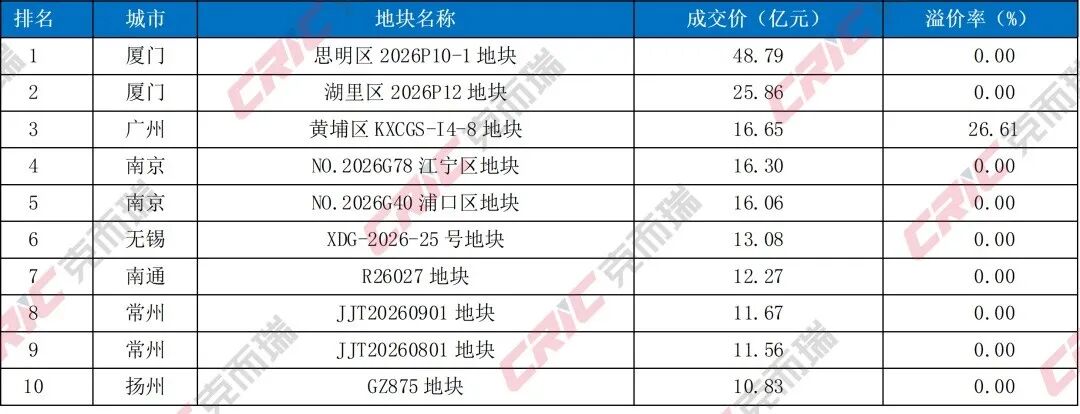
Judging from the land transaction situation, high-value land plots are more distributed in strong second- and third-tier cities in the Yangtze River Delta and core cities such as Xiamen and Guangzhou. The top of the list was the 2026P10-1 plot in Siming District of Xiamen, which was contested by China Resources Land (Xiamen) Co., Ltd. at a reserve price of 4.887 billion yuan, with a floor price of about 48,000 yuan/square meter; the 2026P12 plot in Huli District of Xiamen ranked second with 2,586 billion yuan, with a floor price of 37,700 yuan/square meter; the KXCGS-I4-8 plot in Huangpu District of Guangzhou ranked third with a premium rate of 26.61%, the only transaction price in the TOP10. Of the top 10 total price plots, Xiamen, Nanjing, and Changzhou each accounted for 2 cases, and Guangzhou, Wuxi, Nantong, and Yangzhou each accounted for 1 case. Unlike first-tier cities, which had absolute dominance in August and September, high-priced plots clearly spread to strong second- and third-tier cities in the Yangtze River Delta in October.
Table 5 Ranking of total land prices sold in October 2026
Data source: CRIC China Real Estate Decision Consulting System.
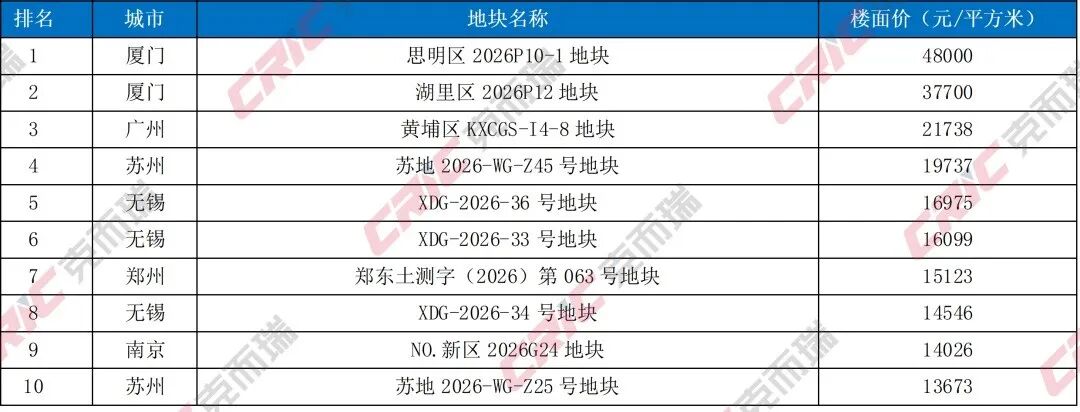
In terms of unit price list, the top of the list is the 2026P10-1 plot in Siming District of Xiamen, with a floor price of 48,000 yuan/square meter; the 2026P12 plot in Huli District of Xiamen ranked second with 37,700 yuan/square meter; the KXCGS-I4-8 plot in Huangpu District of Guangzhou ranked third with 2,1738 yuan/square meter; and plot No. 2026-WG-Z45 in Suzhou High-tech Zone ranked fourth with 19737 yuan/square meter. Among the top ten land plots in unit prices, Xiamen accounted for 2 cases, Wuxi accounted for 3 cases, Suzhou accounted for 2 cases, and Guangzhou, Zhengzhou, and Nanjing each accounted for 1 case. The scarce value of core cities and high-end plots in the core sector of the Yangtze River Delta is still recognized by the market.
Table 6 Ranking of land unit prices sold in October 2026
Data source: CRIC China Real Estate Decision Consulting System.
Overall, the land market showed “shrinkage and cooling” characteristics in October, but high-quality assets in core cities are still attractive. Xiamen is at the top of both the total price and unit price lists. Guangzhou's core plot (KXCGS-I4-8, Huangpu District) is also at the top of the unit price list and is the only premium transaction in the TOP10; cities such as Nantong, Jingdezhen, and Wuhan have seen individual high-premium plots due to scarce local land supply, but this has not changed the characteristics of the overall market popularity declining and floor price transactions becoming mainstream. The long-term logic of “high-quality assets in core cities being sought after” in the land market has not changed.