


EN
Why Did Oppenheimer Holdings (OPY) Stock Drop Today?
Why Oppenheimer Holdings stock is in focus
Oppenheimer Holdings (OPY) is back on investor watch after third quarter results showed revenue of US$382 million and net income of US$5.46 million, along with an affirmed US$0.20 quarterly dividend.
The weak third quarter appears to have hit sentiment hard, with Oppenheimer Holdings’ share price falling 20.14% in the last session and down 28.24% over the past month. Even so, the year-to-date share price return is still up 18.67% and the 3-year total shareholder return sits at 147.27%, suggesting longer-term holders have seen strong gains despite the recent pullback.
Spot sharp pullbacks like Oppenheimer Holdings and compare them with a hand-picked 33 high quality undervalued stocks that may be pricing in very different expectations.
Bulls point to Oppenheimer Holdings’ long run of positive returns and a maintained dividend, while bears focus on the sharp earnings setback and selloff. Which story do the current valuation markers support?
Preferred P/E of 10.7x for Oppenheimer Holdings: Is it justified?
On simple valuation math, Oppenheimer Holdings trades on a P/E of 10.7x, while the last close was $86.20. This puts it below both the broader US market and its own capital markets peer group on this metric.
The P/E ratio compares the current share price with the company’s earnings per share. For a broker dealer and investment bank like Oppenheimer Holdings, this measure gives a quick indication of how much investors are paying for each dollar of profit in a business where earnings can be influenced by deal activity and market volumes.
At 10.7x earnings, the stock is priced lower than the US market average P/E of 18x and below the US Capital Markets industry average of 37.1x. That is a wide gap, and it indicates that the market is assigning a clear discount to Oppenheimer Holdings relative to both the index and sector peers.
See what the numbers say about this price — find out in our valuation breakdown.
Result: Price-to-earnings of 10.7x (UNDERVALUED)
Still, the sharp 28.24% share price decline over the past month and a value score of 2 signal that weaker sentiment around Oppenheimer Holdings could persist.
Find out about the key risks to this Oppenheimer Holdings narrative.
Another view on Oppenheimer Holdings’ valuation
The P/E discount paints Oppenheimer Holdings as cheap, yet the SWS DCF model points a different way. On that cash flow approach, an estimated value of $76.12 per share sits below the current $86.20 price, which suggests the stock screens as overvalued on this metric.
Two models, two messages. The question for you is which risk matters more right now: paying up versus earnings, or paying up versus future cash flows.
Look into how the SWS DCF model arrives at its fair value.
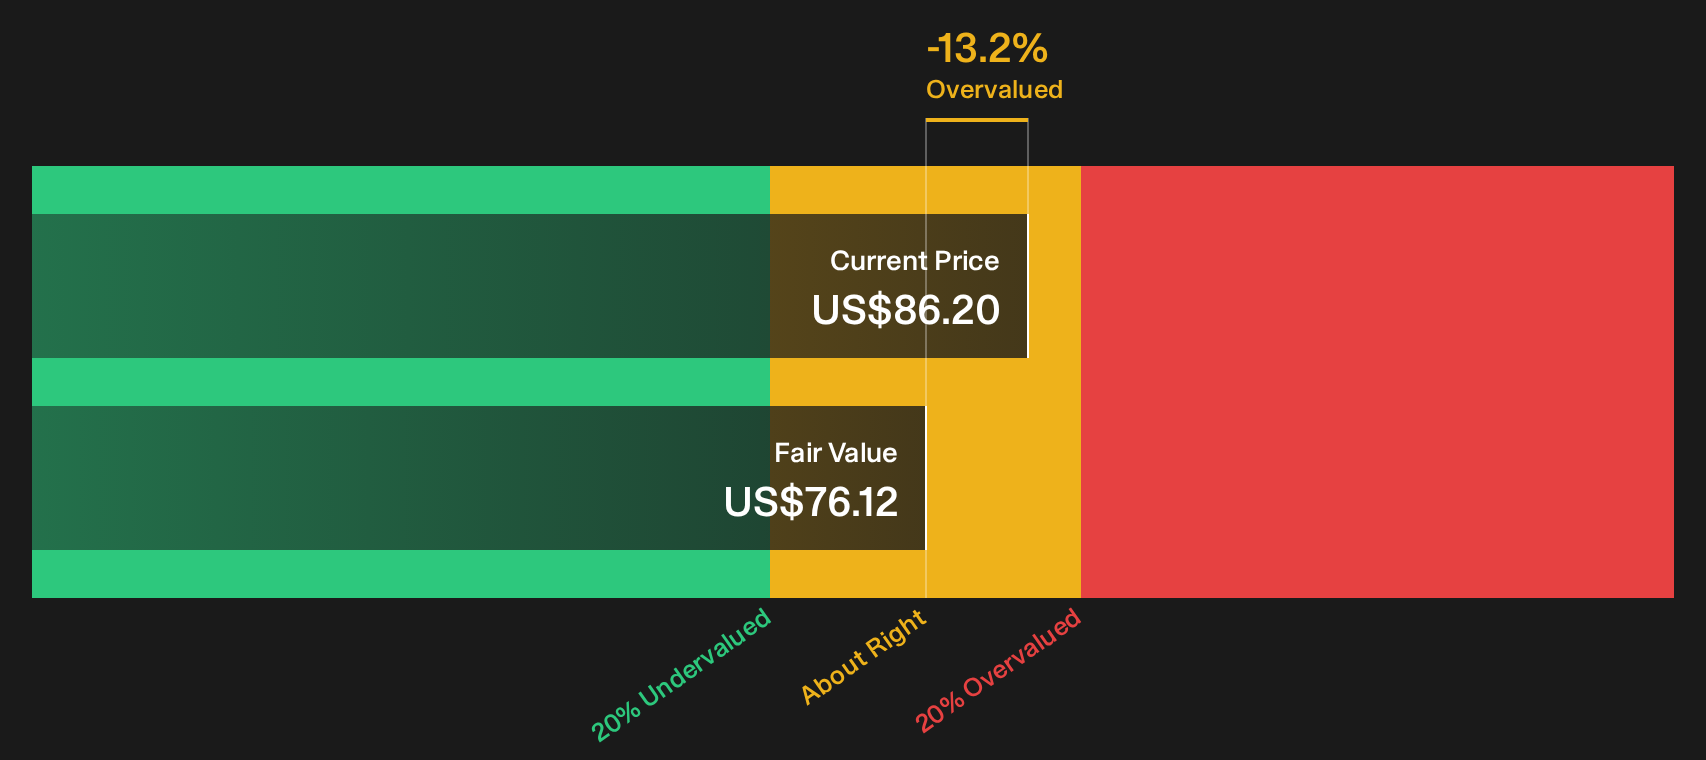
Simply Wall St performs a discounted cash flow (DCF) on every stock in the world every day (check out Oppenheimer Holdings for example). We show the entire calculation in full. You can track the result in your watchlist or portfolio and be alerted when this changes, or use our stock screener to discover 33 high quality undervalued stocks. If you save a screener we even alert you when new companies match - so you never miss a potential opportunity.
Next Steps
Mixed signals on Oppenheimer Holdings so far. If you want to move quickly rather than wait for the next headline, weigh the 1 key reward and 1 important warning sign.
Looking for more ideas beyond Oppenheimer Holdings?
If Oppenheimer Holdings has your attention, do not stop at a single ticker. Cast the net wider with focused stock lists that match your goals and risk tolerance.
- Target resilient balance sheets and steady fundamentals by running a list of solid balance sheet and fundamentals (24 results) that filters for financial strength before you commit fresh capital.
- Hunt for potential bargains by scanning a 19 high quality undiscovered gems that highlights quality businesses investors may not be watching closely yet.
- Dial down portfolio stress and prioritise stability with a 29 resilient stocks with low risk scores that screens for companies with historically lower risk profiles.
Have feedback on this article? Concerned about the content? Get in touch with us directly. Alternatively, email editorial-team@simplywallst.com