


EN
OMRON (TSE:6645) After The Pullback Is The Valuation Still Too Rich
Recent share price moves have pushed OMRON (TSE:6645) into focus for investors after a period of weaker performance over the past month and past 3 months, despite positive recent revenue and net income trends.
Short term momentum for OMRON has cooled, with the share price down 18.01% over the past 30 days and 2.98% over 3 months. However, the year to date share price return of 31.83% and 1 year total shareholder return of 24.70% still indicate relatively stronger longer term performance, even after the recent pullback that suggests investors may be reassessing growth potential and risk.
Compare OMRON's pullback and recent revenue and net income trends against a hand picked group of 95 robotics and automation stocks moving on similar automation and industrial themes.
After a sharp pullback but still solid gains over the past year, and with improving revenue and net income, does OMRON now offer an attractive opportunity for buyers or a value trap in the making as the valuation picture comes into focus?
Preferred P/E of 23.8x: Is it justified?
At recent prices, OMRON trades on a P/E of 23.8x, which leaves the stock looking cheaper than a hand picked peer group but more expensive than the broader JP Electronic industry.
The P/E multiple compares the current share price to earnings per share, so it effectively shows how much investors are paying for each unit of profit. For a business like OMRON, with exposure to industrial automation, healthcare devices and social systems, that benchmark helps frame what the market is willing to pay for its mix of businesses and earnings profile.
Against the selected peer set on 37.3x earnings, the 23.8x P/E suggests investors are paying a lower price for each unit of profit in OMRON, despite annual earnings growth that is forecast at 15.2% per year compared to 9.5% for the JP market. At the same time, the P/E is higher than the JP Electronic industry average of 15x and above the estimated fair P/E of 21.9x.
Explore the SWS fair ratio for OMRON.
Result: Price-to-Earnings of 23.8x (OVERVALUED)
Still, the OMRON story can unravel quickly if recent revenue and net income momentum stalls, or if industrial automation demand softens faster than investors currently expect.
Find out about the key risks to this OMRON narrative.
Another view on OMRON's value
While the P/E hints at a rich price, the SWS DCF model tells a similar story. OMRON trades at ¥5,268 versus an estimated future cash flow value of ¥4,153.59, which points to the shares being overvalued on this second yardstick as well. So is the market paying up for quality, or just paying too much?
Look into how the SWS DCF model arrives at its fair value.
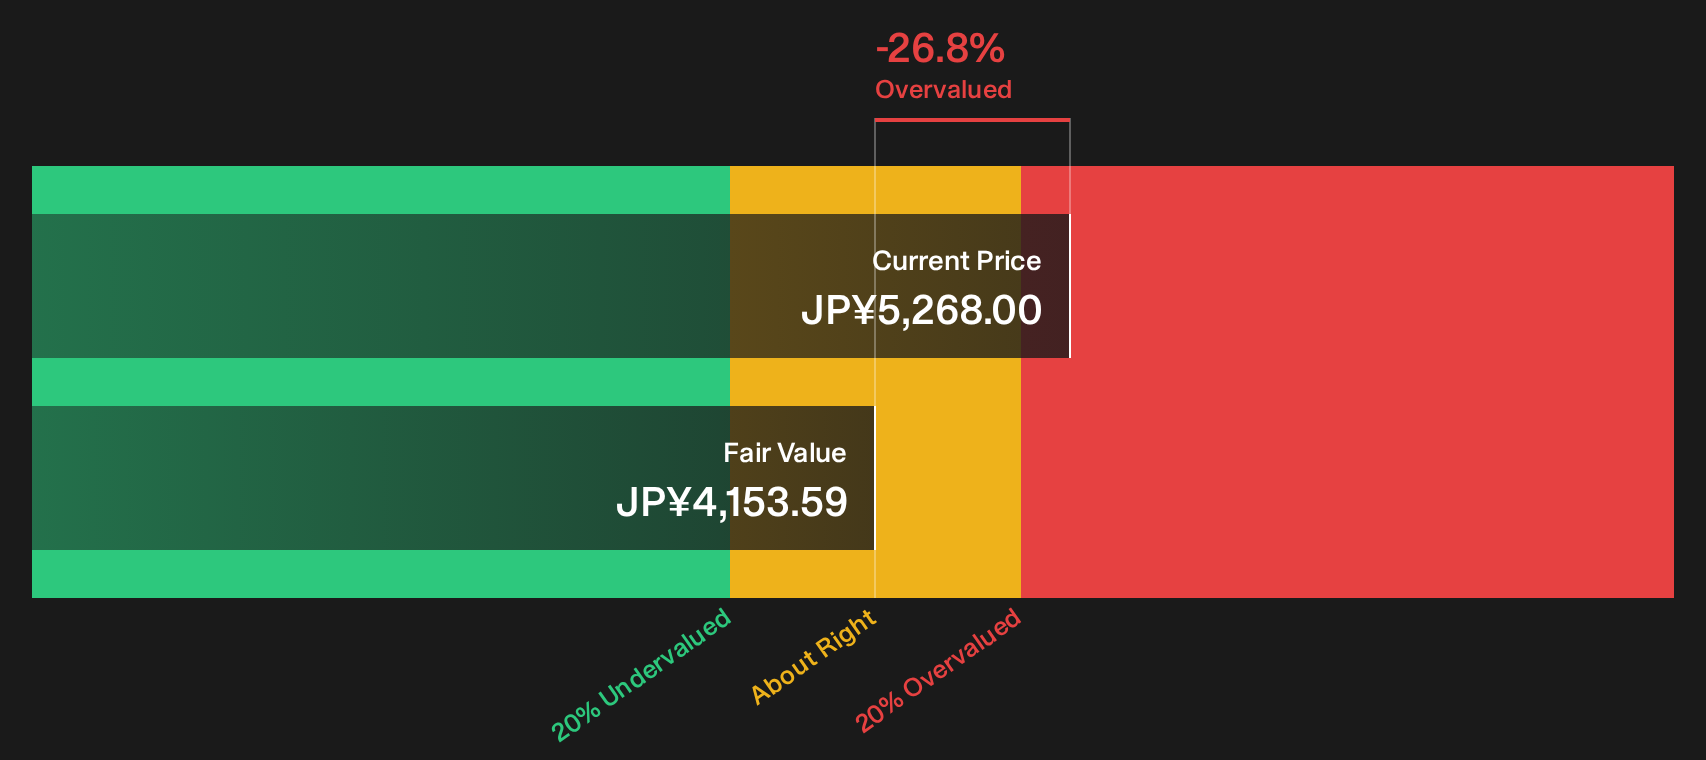
Simply Wall St performs a discounted cash flow (DCF) on every stock in the world every day (check out OMRON for example). We show the entire calculation in full. You can track the result in your watchlist or portfolio and be alerted when this changes, or use our stock screener to discover 16 high quality undervalued stocks. If you save a screener we even alert you when new companies match - so you never miss a potential opportunity.
Next Steps
Mixed signals around OMRON's valuation and business momentum can pull investors in opposite directions, so review the underlying data, weigh both sides carefully, and then check the 2 key rewards and 2 important warning signs.
Looking for more investment ideas beyond OMRON?
Do not stop your research with one stock when a wider set of ideas could sharpen your watchlist and help you spot opportunities that fit your style.
- Target stronger fundamentals by reviewing companies in the list of solid balance sheet and fundamentals (21 results) that pair healthier balance sheets with sturdier core metrics.
- Hunt for potentially mispriced opportunities through the 16 high quality undervalued stocks that highlight quality businesses trading at more modest valuations.
- Build a portfolio tilted toward income resilience by scanning the 28 dividend fortresses that focus on higher yielding payout profiles.
Have feedback on this article? Concerned about the content? Get in touch with us directly. Alternatively, email editorial-team@simplywallst.com