


EN
Learn Why The Bull Case For Mercury General (MCY) Could Change Following Value Stock Recognition
- Mercury General is being highlighted as a value-oriented insurer, with metrics such as a forward P/E of 12.08, P/S of 0.9, and P/CF of 9.50 that currently sit well below the wider insurance industry averages.
- The gap between Mercury General's valuation multiples and sector norms signals that investors are reassessing how its core personal auto and homeowners operations, wildfire exposure, and capital needs are priced into the stock.
- We will look at how Mercury General's investment narrative is affected by this renewed focus on its discounted valuation and earnings outlook.
Scan beyond Mercury General and see how its valuation profile compares with hand picked 33 high quality undervalued stocks that share similar discounted multiples and quality signals.
Mercury General Investment Narrative Recap
For an investor to stay with Mercury General, the core belief is that the underlying auto and homeowners book can keep generating solid underwriting results while wildfire losses and reinsurance costs are managed over time. The current discount on P/E, P/S and P/CF only really matters if that underlying engine proves durable and pricing remains disciplined.
The biggest near term swing factor is how catastrophe experience and related reinsurance terms flow through to earnings and capital. That risk has not gone away and still anchors the bear case. The latest valuation focused news does not materially change that operational equation; it simply sharpens attention on execution.
The most relevant recent development is the renewed spotlight on Mercury General’s valuation, with metrics such as a forward P/E of 12.08, P/S of 0.9 and P/CF of 9.50 sitting well below industry levels. That gap pulls the earnings story and catastrophe management into sharper focus, because the business will be judged against those discounted multiples.
For you as a shareholder, the question becomes whether the company can keep its personal auto and homeowners combined ratios in a healthy range while dealing with wildfire exposure, reinsurance pricing and potential FAIR Plan assessments. If management delivers on underwriting discipline and capital rebuilding, the current value profile could remain a key part of the Mercury General thesis.
Mercury General Earnings and Revenue Set-up
Mercury General is being evaluated on a story where top line growth and shrinking margins pull in different directions over the next few years. Analysts in the consensus snapshot expect revenue to rise by 4.1% each year, while profit margins move from 13.7% today to 9.0% by 2029. That combination matters for you because it frames how much of the future premium volume might actually show up as bottom line profit.
On current numbers, analysts are working off earnings today of $839.8 million and are projecting consensus earnings of $623.9 million by 2029. That outlook reflects the impact of wildfire exposure, reinsurance costs and lower assumed profitability on the personal auto and homeowners portfolios. For anyone following the stock, the key is how those pressures translate into actual underwriting choices, pricing, and risk selection in California and other core markets.
Against that backdrop, the revenue line is expected to reach $6.9b and earnings are forecast at $623.9 million in 2029, based on the analyst valuation summary. These figures sit alongside the discussion of a P/E multiple of 13.1x on those earnings, compared with 6.7x today, and help explain why a discounted current valuation is drawing attention. The gap between forecast earnings, the lower margin profile and a higher assumed future multiple is what you are really being asked to weigh when comparing Mercury General with other insurers that screen as undervalued.
Mercury General's narrative ties to analyst expectations that revenues will reach $6.9b and earnings will come in at $623.9 million by 2029. This assumes 4.1% yearly revenue growth and an earnings decrease of $215.9 million from $839.8 million.
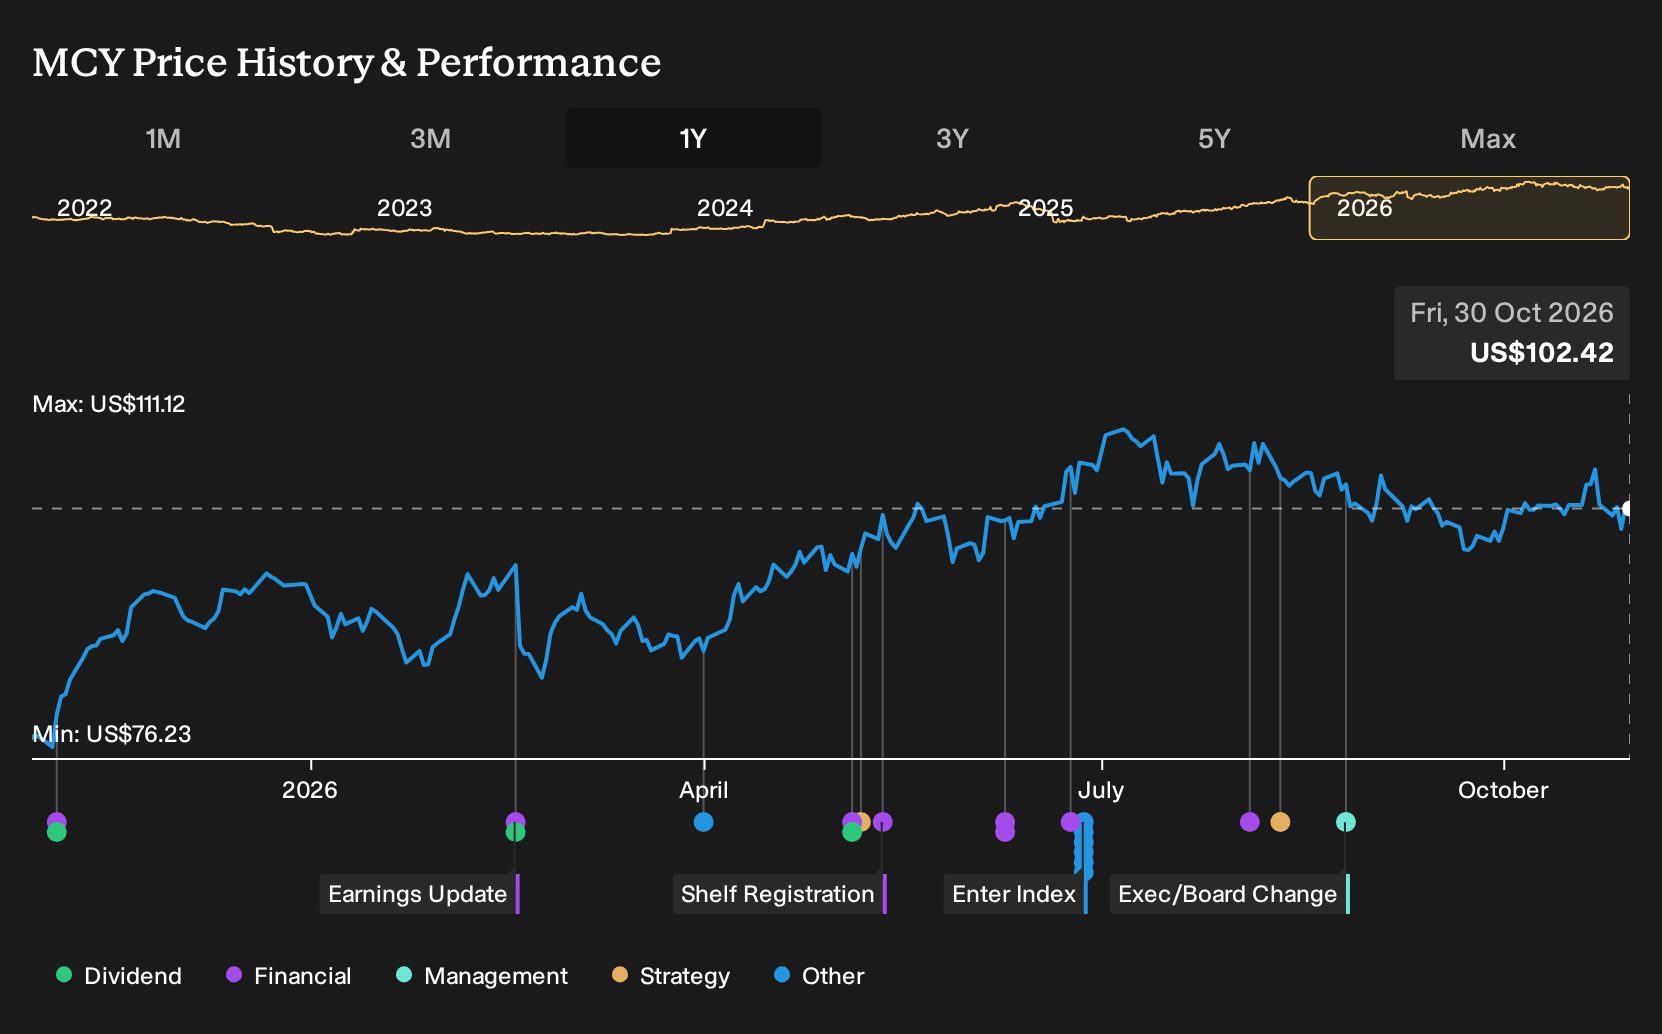
Uncover how Mercury General's fair value indicates a 17% potential upside to its current price that may not last much longer.
Exploring Other Perspectives
Four fair value estimates from the Simply Wall St Community cluster between US$102.88 and US$164.03, which points to a wide gap in how retail investors frame Mercury General’s potential. You are weighing those optimistic models against wildfire loss risk, reinsurance costs, and FAIR Plan assessments that could all influence future earnings resilience.
Explore 3 other Mercury General fair value estimates, including one that suggests it could be worth just $102.88.
Reach Your Own Conclusion
Disagree with existing narratives? Extraordinary investment returns rarely come from following the herd, so go with your instincts.
- A great starting point for your Mercury General research is our analysis highlighting 2 key rewards that could impact your investment decision.
- See our latest analysis for Mercury General. The report includes a comprehensive fundamental analysis summarized in a single visual, the Snowflake, making it easy to evaluate Mercury General's overall financial health at a glance.
Looking for more investment ideas beyond Mercury General?
If you want to cross check Mercury General against other opportunities, a quick pass through the Simply Wall St Screener can surface companies with similar qualities but different risk and return profiles.
- For investors who care about valuation and balance sheet strength together, scan a curated list of solid balance sheet and fundamentals (24 results) that combine financial resilience with cleaner fundamentals.
- If you are weighing Mercury General against other potentially mispriced opportunities, compare it with a 19 high quality undiscovered gems that have strong fundamentals but limited market attention.
- When capital preservation matters most, you can contrast Mercury General with a 29 resilient stocks with low risk scores that show more measured risk scores based on their financial and business profiles.
Have feedback on this article? Concerned about the content? Get in touch with us directly. Alternatively, email editorial-team@simplywallst.com