


EN
Is Heritage Financial (HFWA) A Bargain After Its New CIO Appointment?
Heritage Financial’s New CIO Appointment
Heritage Financial (HFWA) just added a new technology leader by appointing Pat Casey as Executive Vice President and Chief Information Officer, with a mandate that spans data architecture, cybersecurity, cloud systems, and merger related integration work.
Heritage Financial’s shares have pulled back over the past week and quarter, with the 7 day share price return down 2.33% and the 90 day share price return down 5.13%. However, the year to date share price return of 20.13% and 1 year total shareholder return of 33.14% still indicate positive momentum supported by recent earnings, dividends and buybacks.
Scan how Heritage Financial compares with a hand picked list of solid balance sheet and fundamentals (24 results) as investors consider new leadership, dividends, and buybacks in the banking sector.
Bulls point to Heritage Financial’s dividend, buyback and earnings profile. Bears focus on the recent share pullback and softer quarterly profit. Which side do the valuation numbers lean toward next?
Most Popular Narrative: 12% Undervalued
Heritage Financial’s most followed narrative pins fair value at $32.40 compared with the recent $28.47 close, framing a valuation gap that hinges heavily on execution and efficiency rather than broad regional growth.
Completion of the Olympic and Kitsap integrations, including the late September systems conversion and the expected step down in quarterly noninterest expense from roughly $64 million to about $56 million to $57 million in Q4, could reveal a lower operating cost base and support higher net margins and earnings.
See why 2 investors see Heritage Financial as 12% undervalued.
Result: Fair Value of $32.40 (UNDERVALUED)
Still, if loan prepayments stay elevated or deposit competition forces higher funding costs, the Heritage Financial narrative could shift away from that 12% undervalued case.
Find out about the key risks to this Heritage Financial narrative.
Another View: Heritage Financial Through The P/E Lens
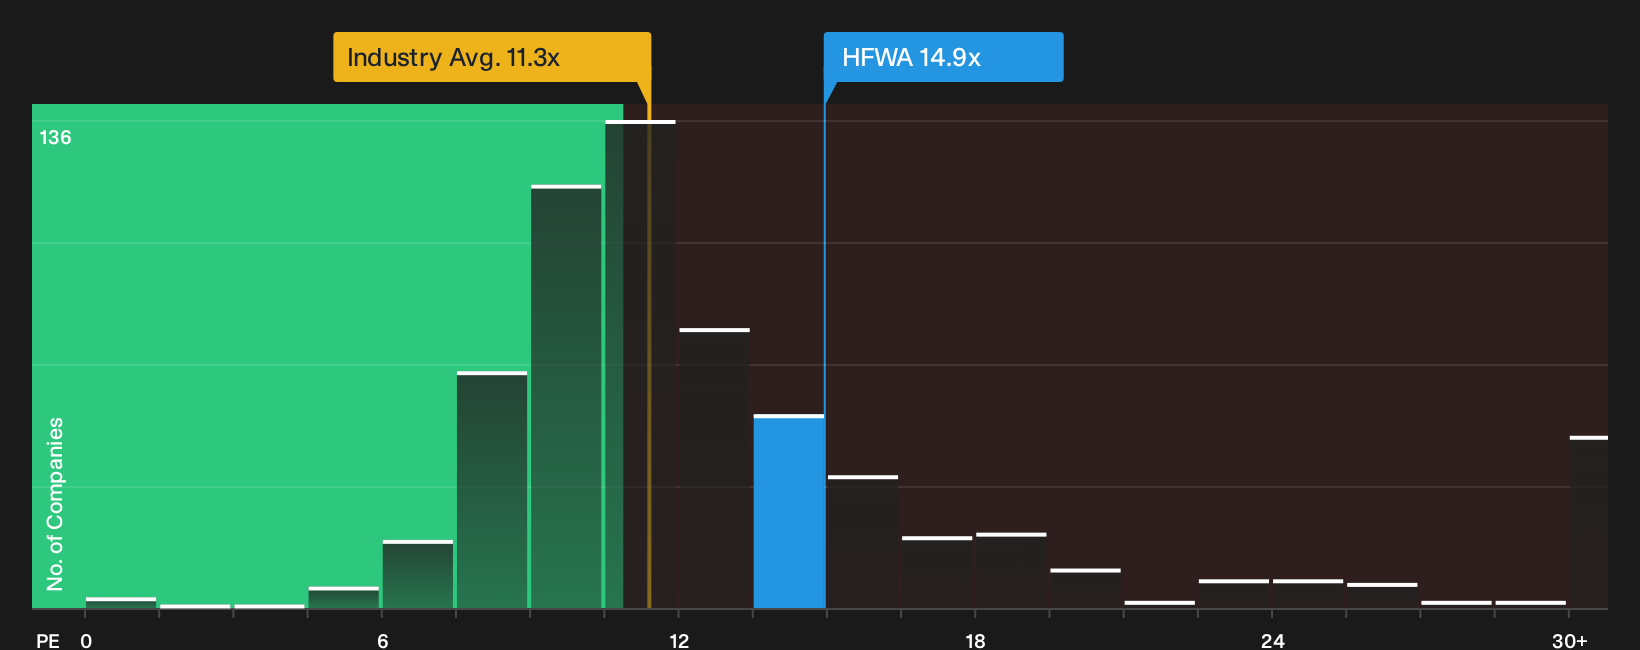
Heritage Financial screens very differently once you look at the P/E ratio instead of the narrative fair value. The stock trades on 14.9x earnings, while the US Banks industry sits at 11.4x and peers at 12.5x, and the fair ratio points to 13.6x. That richer multiple can signal investors are paying up for quality earnings, or it can simply mean there is less room for error if growth or returns fall short. Which story do you think the market is really pricing in right now?
To pressure test that question against hard numbers, review how the current multiple compares with the fair ratio and sector peers in more detail, then weigh whether that premium feels earned or fragile through the See what the numbers say about this price — find out in our valuation breakdown..
Next Steps
Mixed signals around Heritage Financial’s valuation and recent share pullback make this a moment to look directly at the underlying data and act quickly on your own judgment using the 3 key rewards and 3 important warning signs.
Looking for more investment ideas beyond Heritage Financial?
If Heritage Financial is on your radar, widen your opportunity set with a few focused stock ideas where balance sheets, income potential, and downside risk all get a close look.
- Target resilience first and scan a 29 resilient stocks with low risk scores that filters for businesses with sturdier fundamentals when you want potential returns without ignoring volatility.
- Pursue income opportunities and review a 5 dividend fortresses that highlights companies offering higher yields while still paying attention to financial strength and payout consistency.
- Hunt for mispriced quality and sort through a 19 high quality undiscovered gems focused on financially solid businesses that are not yet widely followed by the market.
Have feedback on this article? Concerned about the content? Get in touch with us directly. Alternatively, email editorial-team@simplywallst.com