


EN
Sanwa Holdings (TSE:5929) Approves Buyback And Posts Results, Is It Still Below Fair Value?
Sanwa Holdings (TSE:5929) is back in focus after the board signed off on a share repurchase program worth ¥10,000 million, alongside fresh half year results and an updated management plan timetable.
The sharp 11.4% 1-day share price return, with the stock now at ¥3,935.0, lines up closely with the buyback announcement and updated plan. The year-to-date share price return is still down 4.6%, even after a 14.3% 90-day gain and a 260.4% 5-year total shareholder return that points to powerful long-run momentum.
Scan for other construction and industrial stocks with strong capital return policies, including buybacks like Sanwa Holdings, by running the curated 16 high quality undervalued stocks.
Sanwa Holdings now has a buyback, a refreshed plan and a long record of shareholder returns in the rear-view mirror. The open question is whether the current price still reflects good value or already bakes that in.
Preferred P/E of 14.2x for Sanwa Holdings: Is it justified?
On current numbers Sanwa Holdings trades on a P/E of 14.2x, which sits below its own fair P/E estimate of 15.1x but above the 12x average in the JP Building industry. At a share price of ¥3,935 this points to investors paying a moderate earnings multiple that the fair ratio work still frames as supported by the fundamentals.
The P/E ratio compares the current share price to earnings per share. For a construction metal products group like Sanwa Holdings, this is a common yardstick because profits tie closely to building activity and replacement demand across Japan, North America, Europe and Asia. A mid-teens P/E often indicates that the market is factoring in steady profitability rather than rapid expansion.
Sanwa Holdings appears inexpensive when judged against the peer group average of 17.3x, which suggests the market is not placing a premium on its earnings relative to similar companies. At the same time the P/E sits above the sector average of 12x, which indicates investors are still willing to pay more than the typical building stock for its earnings stream. The estimated fair P/E of 15.1x is higher than today’s 14.2x. This can be interpreted as a sign that the valuation may have room to move closer to that level if current earnings quality and cash generation persist.
Explore the SWS fair ratio for Sanwa Holdings.
Result: Price-to-Earnings of 14.2x (UNDERVALUED)
Still, the recent share price jump and the already strong 5 year return could leave Sanwa Holdings exposed if earnings delivery or buyback execution disappoints.
Find out about the key risks to this Sanwa Holdings narrative.
Another view on Sanwa Holdings using cash flows
The earlier P/E work paints Sanwa Holdings as modestly cheap. Our DCF model tells a similar story, with the shares at ¥3,935 trading about 19% below an estimated future cash flow value of ¥4,859.63. That points to a discount, but it is unclear whether this is compensation for slower 3% forecast growth.
Look into how the SWS DCF model arrives at its fair value.
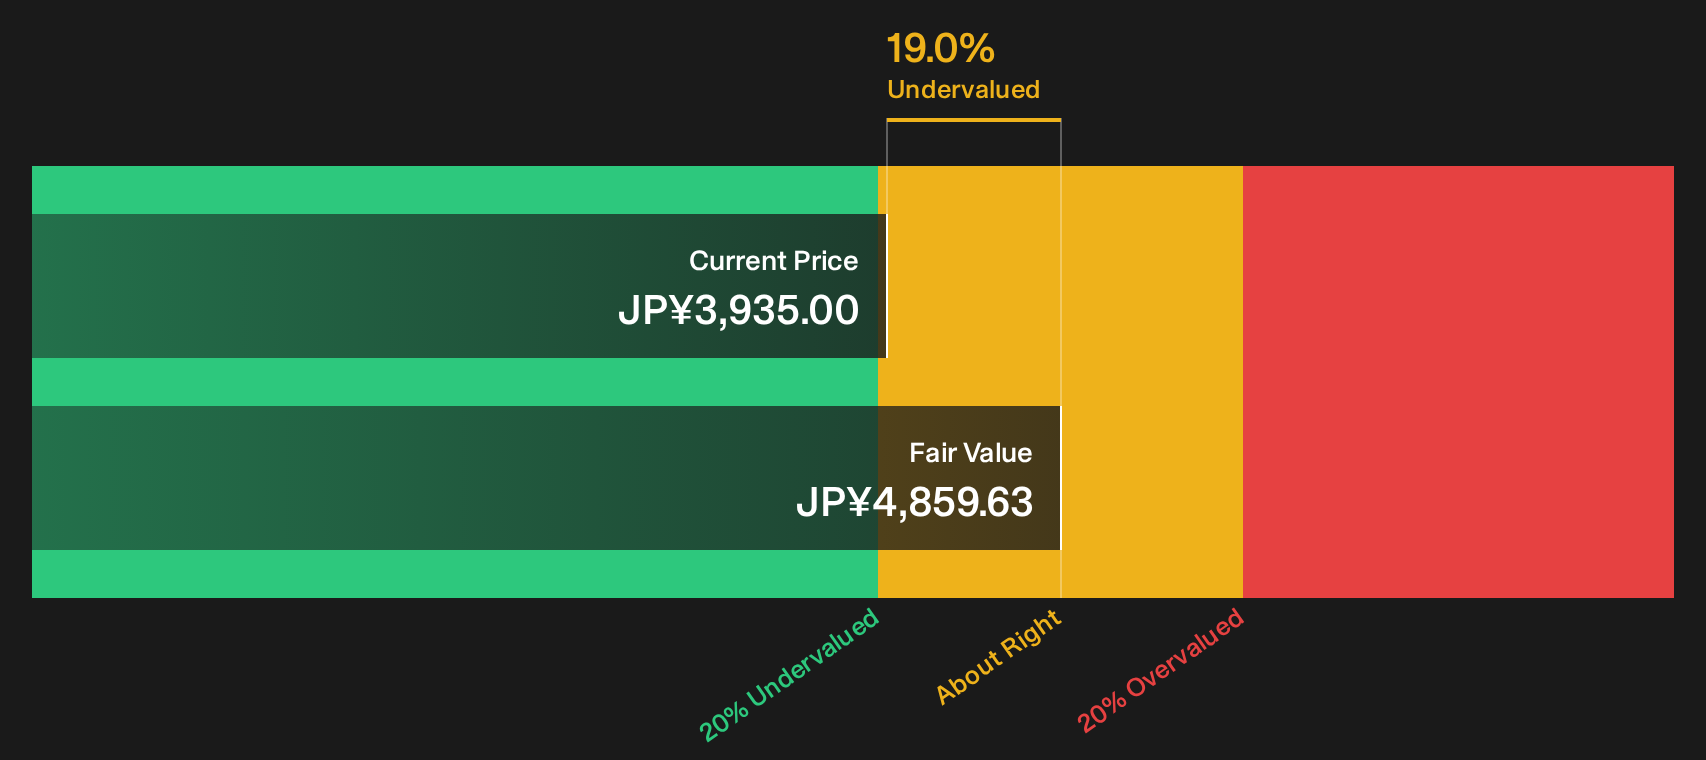
Simply Wall St performs a discounted cash flow (DCF) on every stock in the world every day (check out Sanwa Holdings for example). We show the entire calculation in full. You can track the result in your watchlist or portfolio and be alerted when this changes, or use our stock screener to discover 16 high quality undervalued stocks. If you save a screener we even alert you when new companies match - so you never miss a potential opportunity.
Next Steps
Strong optimism around Sanwa Holdings is clear, yet the real edge comes from testing those conclusions against the raw numbers yourself and moving early. To see what others view as the key positives, take a closer look at the 3 key rewards.
Looking for more investment ideas beyond Sanwa Holdings?
If you stop with Sanwa Holdings, you risk missing other setups that fit your style, your risk comfort, and your return expectations across different sectors and themes.
- Target higher income potential and shortlist companies that aim to pay sturdy payouts by scanning the 28 dividend fortresses.
- Hunt for quality at a markdown and spot opportunities that pair financial strength with attractive pricing through the 69 high quality undiscovered gems.
- Prioritise capital protection and focus on businesses that aim for resilience first by reviewing the 23 resilient stocks with low risk scores.
Have feedback on this article? Concerned about the content? Get in touch with us directly. Alternatively, email editorial-team@simplywallst.com