


EN
Flagstar Bank National Association (FLG) Just Gave Investors Something To Think About
Flagstar Bank National Association (FLG) has just put several capital decisions on the table. Fresh third quarter profits, a completed buyback, and newly declared dividends are now shaping the risk and reward profile for shareholders.
Against that backdrop, Flagstar Bank National Association’s share price has drifted, with a 30 day share price return down 10.17% and a 90 day share price return down 26.09%, even after the buyback, dividend declarations, and return to quarterly profitability. Over a longer horizon, the total shareholder return has also been weak, with the 1 year total shareholder return down 7.69% and the 3 year total shareholder return down 63.12%. This suggests that investors are still reassessing both the earnings recovery and the risks flagged by recent net charge offs, despite the current US$10.51 share price.
Scan beyond Flagstar Bank National Association and compare other banks that blend capital actions, dividends, and recent earnings catalysts using our curated list of solid balance sheet and fundamentals (24 results)
Flagstar Bank National Association now trades at a double discount, with the share price below both intrinsic value estimates and analyst targets. Is the market’s caution after recent charge offs and weak long term returns still warranted?
Most Popular Narrative: 30% Undervalued
On the most followed view, Flagstar Bank National Association carries an assessed fair value of $15.06 against a last close of $10.51. This places the burden of proof on whether the earnings story can catch up to that gap.
Flagstar is deliberately rotating out of low coupon multifamily and CRE into higher yielding C&I and new, geographically diversified CRE while also paying down nearly $20 billion of high cost wholesale funding and lowering deposit costs. The combined effect of mix shift and cheaper liabilities could structurally widen net interest margin far more than implied by a flat share price outlook.
See why 8 investors see Flagstar Bank National Association as 30% undervalued.
Result: Fair Value of $15.06 (UNDERVALUED)
Still, that discount only holds if credit issues related to the US$74 million in quarterly net charge offs and the large New York multifamily book do not deepen.
Find out about the key risks to this Flagstar Bank National Association narrative.
Another View: Multiples Point The Other Way
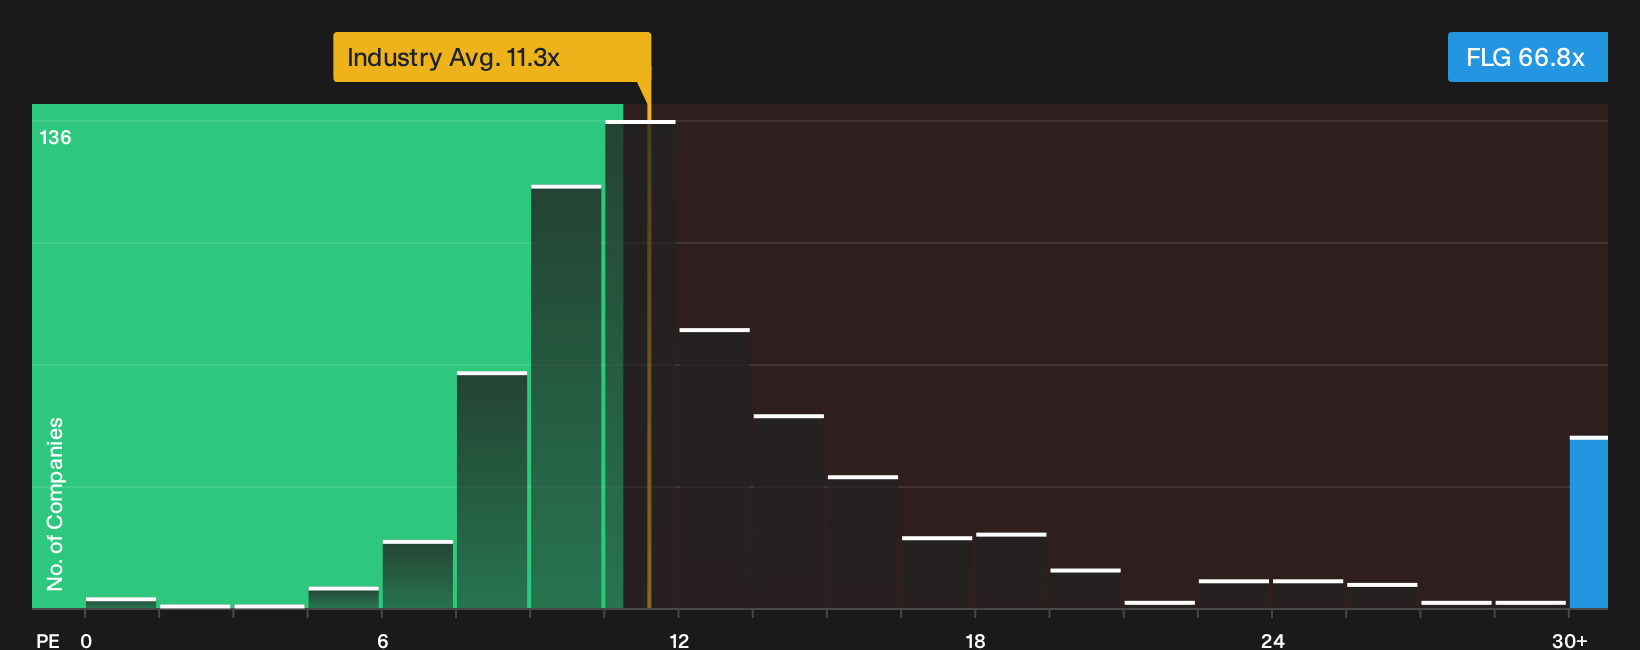
There is a catch. On the current numbers, Flagstar Bank National Association trades on a P/E of 66.8x, which is materially above both the US Banks industry at 11.4x and the peer group at 12.8x. The fair ratio sits lower again at 53.1x, so any move toward that level would mean valuation pressure, not upside.
That gap between the present P/E and the fair ratio suggests the bullish fair value narrative leaves little room for disappointment if earnings or credit trends do not match expectations. This raises the question of which yardstick investors should trust most.
See what the numbers say about this price — find out in our valuation breakdown.
Next Steps
Mixed messages across valuation, earnings and credit risk can pull investors in opposite directions, so move quickly through the numbers yourself and decide what matters most for your portfolio. To weigh those trade offs in one place, take a close look at the 3 key rewards and 2 important warning signs.
Looking for more investment ideas beyond Flagstar Bank National Association?
If Flagstar Bank National Association has you weighing risk and reward, consider broadening your watchlist with other opportunities that match clear, fundamentals based filters before the market does.
- Target resilient compounding by scanning companies with strong cash generation and attractive valuations through the 33 high quality undervalued stocks.
- Prioritize sleep at night holdings by filtering for businesses that combine low risk profiles with consistent fundamentals using the 29 resilient stocks with low risk scores.
- Hunt for under followed potential by surfacing fundamentally sound smaller companies through the 19 high quality undiscovered gems.
Have feedback on this article? Concerned about the content? Get in touch with us directly. Alternatively, email editorial-team@simplywallst.com