


EN
Mixed Quarter Earnings Might Change The Case For Investing In Graham Holdings (GHC)
- Graham Holdings reported third quarter 2026 revenue of US$1,326.04 million compared with US$1,278.86 million a year earlier, while quarterly net income was US$75.11 million versus US$122.93 million.
- Over the first nine months of 2026, the group reported higher revenue and net income than the prior year, with basic earnings per share from continuing operations at US$89.84 compared with US$42.15. This result contrasts with the softer third quarter profit.
- Next, the focus is on how Graham Holdings' stronger year to date profitability alongside weaker third quarter net income might influence the overall investment narrative.
See how investors are revaluing companies after mixed earnings from Graham Holdings by reviewing our curated list of 30 high quality undervalued stocks.
What Is Graham Holdings' Investment Narrative?
The Graham Holdings story really hinges on whether you believe this eclectic mix of education, media, healthcare and industrial assets can consistently turn solid cash flow into shareholder value. Third quarter results complicate that picture. Revenue moved higher while earnings per share from continuing operations dropped to US$17.79, which reinforces the existing issue of profit margins sitting at 9.6% compared with 14.8% last year. In the short term, that makes execution on pricing, cost control and capital allocation the real swing factors rather than headline growth.
Nine month net income of US$385.32 million and basic EPS of US$89.84 show the year is still running well ahead of last year, so the latest quarter looks more like a profitability wobble than a collapse in demand. The risk is that a diversified structure, combined with capital intensive segments like manufacturing and automotive, can make margin pressure harder to fix quickly even if the stock appears to trade on a 9.9x P/E and at a large discount to estimated cash flow value.
Yet the more interesting part of the Graham Holdings story is what happens if that margin pressure persists just as ...
There's only one way to know the right time to buy, sell or hold Graham Holdings. Head to Simply Wall St's company report for the latest analysis of Graham Holdings's Fair Value.
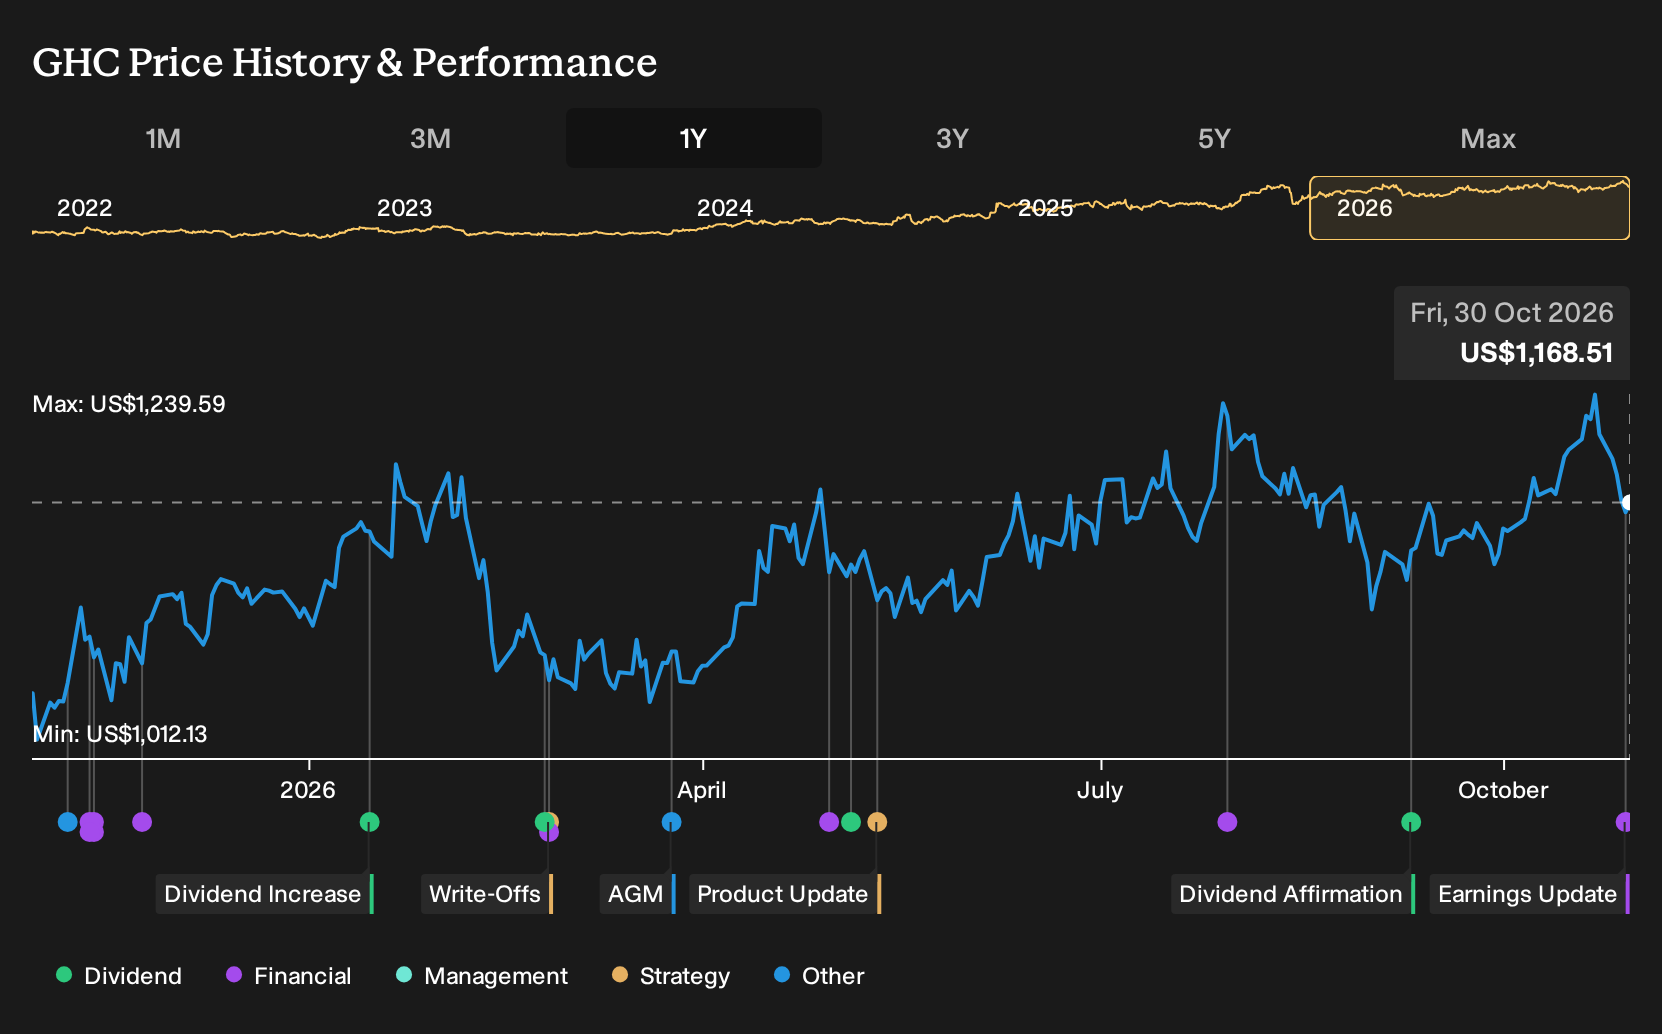
Exploring Other Perspectives
Three fair value estimates from the Simply Wall St Community range from about US$1,100 to over US$2.3m, which illustrates how widely opinions on Graham Holdings can vary before new data is incorporated into analysis. Those numbers all predate the October earnings, so you may want to test your own view against several contrasting community perspectives.
Explore 2 other Graham Holdings fair value estimates, including one that suggests as much as 198853% upside from the current price!
Decide For Yourself
Disagree with this assessment? Extraordinary investment returns rarely come from following the herd, so go with your instincts.
- A great starting point for your Graham Holdings research is our analysis highlighting 1 key reward and 1 important warning sign that could impact your investment decision.
- See our latest analysis for Graham Holdings. The report includes a comprehensive fundamental analysis summarized in a single visual, the Snowflake, making it easy to evaluate Graham Holdings' overall financial health at a glance.
Looking For More Investment Ideas Beyond Graham Holdings?
If Graham Holdings has sharpened your thinking about risk, return and timing, it can help to compare it with a wider set of opportunities. The Simply Wall St Screener lets you filter by quality, balance sheet strength and income profile so you can build a watchlist that actually matches your goals.
- If you care most about quality at a reasonable price, start by scanning for companies that look mispriced on fundamentals with our 30 high quality undervalued stocks.
- If capital preservation matters to you, focus on businesses with stronger financial footing by running a list of solid balance sheet and fundamentals (24 results).
- If you want ideas the market may be overlooking, cast a wider net across less followed stocks using our 19 high quality undiscovered gems.
Have feedback on this article? Concerned about the content? Get in touch with us directly. Alternatively, email editorial-team@simplywallst.com