


EN
Nebius Group (NBIS) Tests Its AI Story After Analyst Upgrades And A Fair Value Reset
Nebius Group (NasdaqGS:NBIS) is back in focus after a fresh run of upbeat analyst commentary and its addition to the Zacks Rank #1 list. This development is reinforcing interest in its AI infrastructure story.
Recent headlines have collided with a sharp pullback, with Nebius Group’s share price falling 10.4% on the day and 34.7% over 30 days. Even though the year-to-date share price return is 71.3% and the 1-year total shareholder return is 17.8%, this points to strong longer-term gains but fading short-term momentum as investors reassess AI infrastructure risk and funding needs.
Scan how Nebius Group fits within a wider AI buildout story by comparing it to a curated list of 54 AI infrastructure stocks that are also dealing with heavy capex and demand for GPU capacity.
Nebius Group now sits between two stories. A sharp pullback has reset expectations after a big year-to-date gain. The question is whether the current price still reflects more runway or a rally mostly cashed in.
Most Popular Narrative: 41% Undervalued
Nebius Group last closed at $154.10, while the most followed narrative assigns a fair value near $260 per share. That gap frames the pullback as a valuation reset rather than a full break in the story.
The $260 fair value represents our working estimate of what NBIS could be worth if the company delivers strong AI-cloud growth and improves profitability. It should be treated as an upside target rather than evidence that the shares are clearly cheap, because NBIS trades at approximately 42.3 times sales, compared with a peer average of approximately 9.8 times.
See why 25 investors see Nebius Group as 41% undervalued.
Result: Fair Value of $259.97 (UNDERVALUED)
Still, the whole Nebius Group story leans heavily on capital hungry AI buildout and a large Microsoft agreement that could disappoint if utilisation or cash flow lags.
Find out about the key risks to this Nebius Group narrative.
Another View: What Nebius Group's Sales Multiple Is Telling You
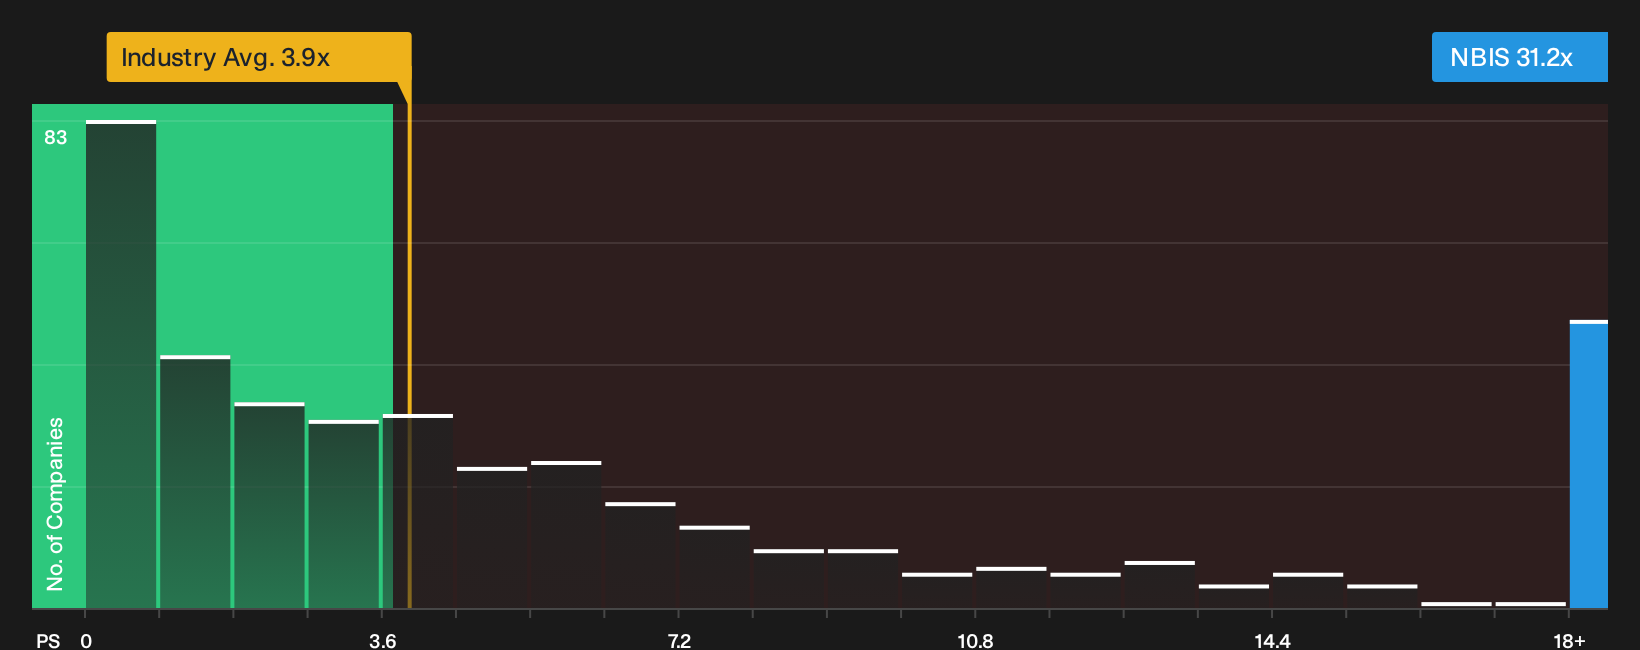
The first story frames Nebius Group as deeply undervalued against a $260 fair value. A different lens uses its P/S ratio of 31.2x compared with a US Software average of 3.9x and a peer average of 9.9x, even though the fair ratio is 36.3x.
That gap suggests the market already prices in a lot of success for Nebius Group, even if it still trades below where the fair ratio implies the multiple could move. The question is whether future execution justifies paying so far above sector norms for that potential.
See what the numbers say about this price — find out in our valuation breakdown.
Next Steps
Mixed signals like this can be confusing, and you do not have weeks to sit on the fence while new data and sentiment settle. Instead, take a closer look at both sides of the story and weigh up the 2 key rewards and 4 important warning signs.
Looking For More Investment Ideas Beyond Nebius Group?
Do not stop your research with Nebius Group when there are other opportunities that might match your risk level, income needs and return expectations.
- Target steadier growth potential by reviewing a 30 resilient stocks with low risk scores that filters for resilience when conditions turn choppy.
- Hunt for mispriced quality by scanning the 18 high quality undiscovered gems that screen for strong fundamentals hiding outside the usual headlines.
- Strengthen capital preservation by focusing on companies in the list of solid balance sheet and fundamentals (25 results) that emphasise robust financial footing alongside fundamentals.
Have feedback on this article? Concerned about the content? Get in touch with us directly. Alternatively, email editorial-team@simplywallst.com