


EN
Titan America (TTAM) Approves A New Cash Distribution, Is The Stock Still Undervalued?
Titan America (TTAM) is back on income investors’ radar after its board approved a fourth quarter 2026 cash distribution of US$0.04 per common share, funded from the company’s available issue premium.
The US$13.87 share price has edged higher over the past week but remains down over the year. The 90 day share price return fell 10.4% and the year to date share price return declined 17%, while the 1 year total shareholder return is down a milder 5.1%. This suggests that income distributions like Titan America’s latest payout have partly cushioned the overall hit for long term holders.
Scan for other income-focused opportunities on Simply Wall St by checking out 5 dividend fortresses alongside Titan America after this latest distribution update.
Titan America now trades at US$13.87 after a mixed year of returns, so the key question for investors is whether that recent income support justifies taking on the current risk profile.
Most Popular Narrative: 20% Undervalued
Against the last close of $13.87, the most followed narrative for Titan America points to a fair value near $17.29, with that gap resting on assumptions about future earnings power and capital returns.
A strong balance sheet with low net leverage at 0.71 times EBITDA and significant free cash flow generation, coupled with continued capital returns via share premium distributions and potential value accretive M&A, could support higher investor confidence and multiple expansion. This may lead to a structurally higher valuation level and upward pressure on the share price through both earnings and net margin resilience.
See why 2 investors see Titan America as 20% undervalued.
Result: Fair Value of $17.29 (UNDERVALUED)
Still, the narrative around Titan America can shift if the planned aggregates expansion at Pennsuco and the new precast lintel push generate stronger profitability than analysts currently model.
Find out about the key risks to this Titan America narrative.
Another View On Titan America’s Valuation
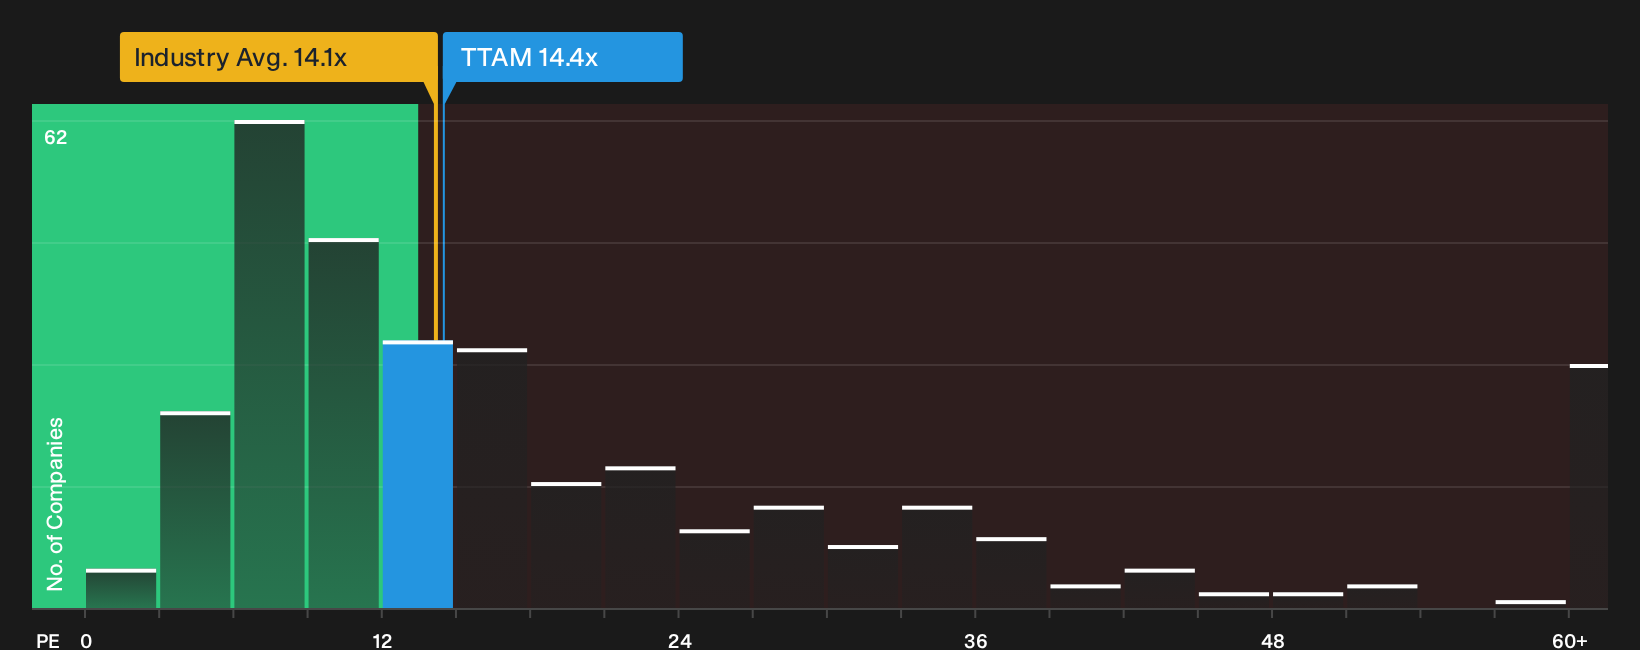
The DCF work paints one picture of Titan America, yet the P/E tells a more cautious story. TTAM trades on a 14.4x P/E, slightly richer than the 14.3x Global Basic Materials average, but below a fair ratio of 16.8x. This points to some valuation support. The real question is whether that gap reflects mispricing or just the right amount of risk being priced in by the market.
See what the numbers say about this price in our valuation breakdown through the See what the numbers say about this price — find out in our valuation breakdown..
Next Steps
Mixed signals around Titan America’s valuation and income profile can feel confusing, so act while the data is fresh and decide where you stand using the 4 key rewards and 1 important warning sign.
Looking for more Titan America sized ideas?
If Titan America has you thinking about what to own next, use the Simply Wall St Screener to quickly surface fresh opportunities that fit your checklist.
- Target resilient payouts by comparing Titan America with other income plays using the 5 dividend fortresses before ex dates creep up on you.
- Hunt for quality at a discount and stack Titan America against a 29 high quality undervalued stocks that share strong fundamentals and cleaner balance sheets.
- Seek tomorrow’s potential leaders early and weigh Titan America beside a 18 high quality undiscovered gems that many investors may be overlooking.
Have feedback on this article? Concerned about the content? Get in touch with us directly. Alternatively, email editorial-team@simplywallst.com