


EN
When a Wheat Spread Moves Against Seasonality: Why I Held the Trade
Introduction
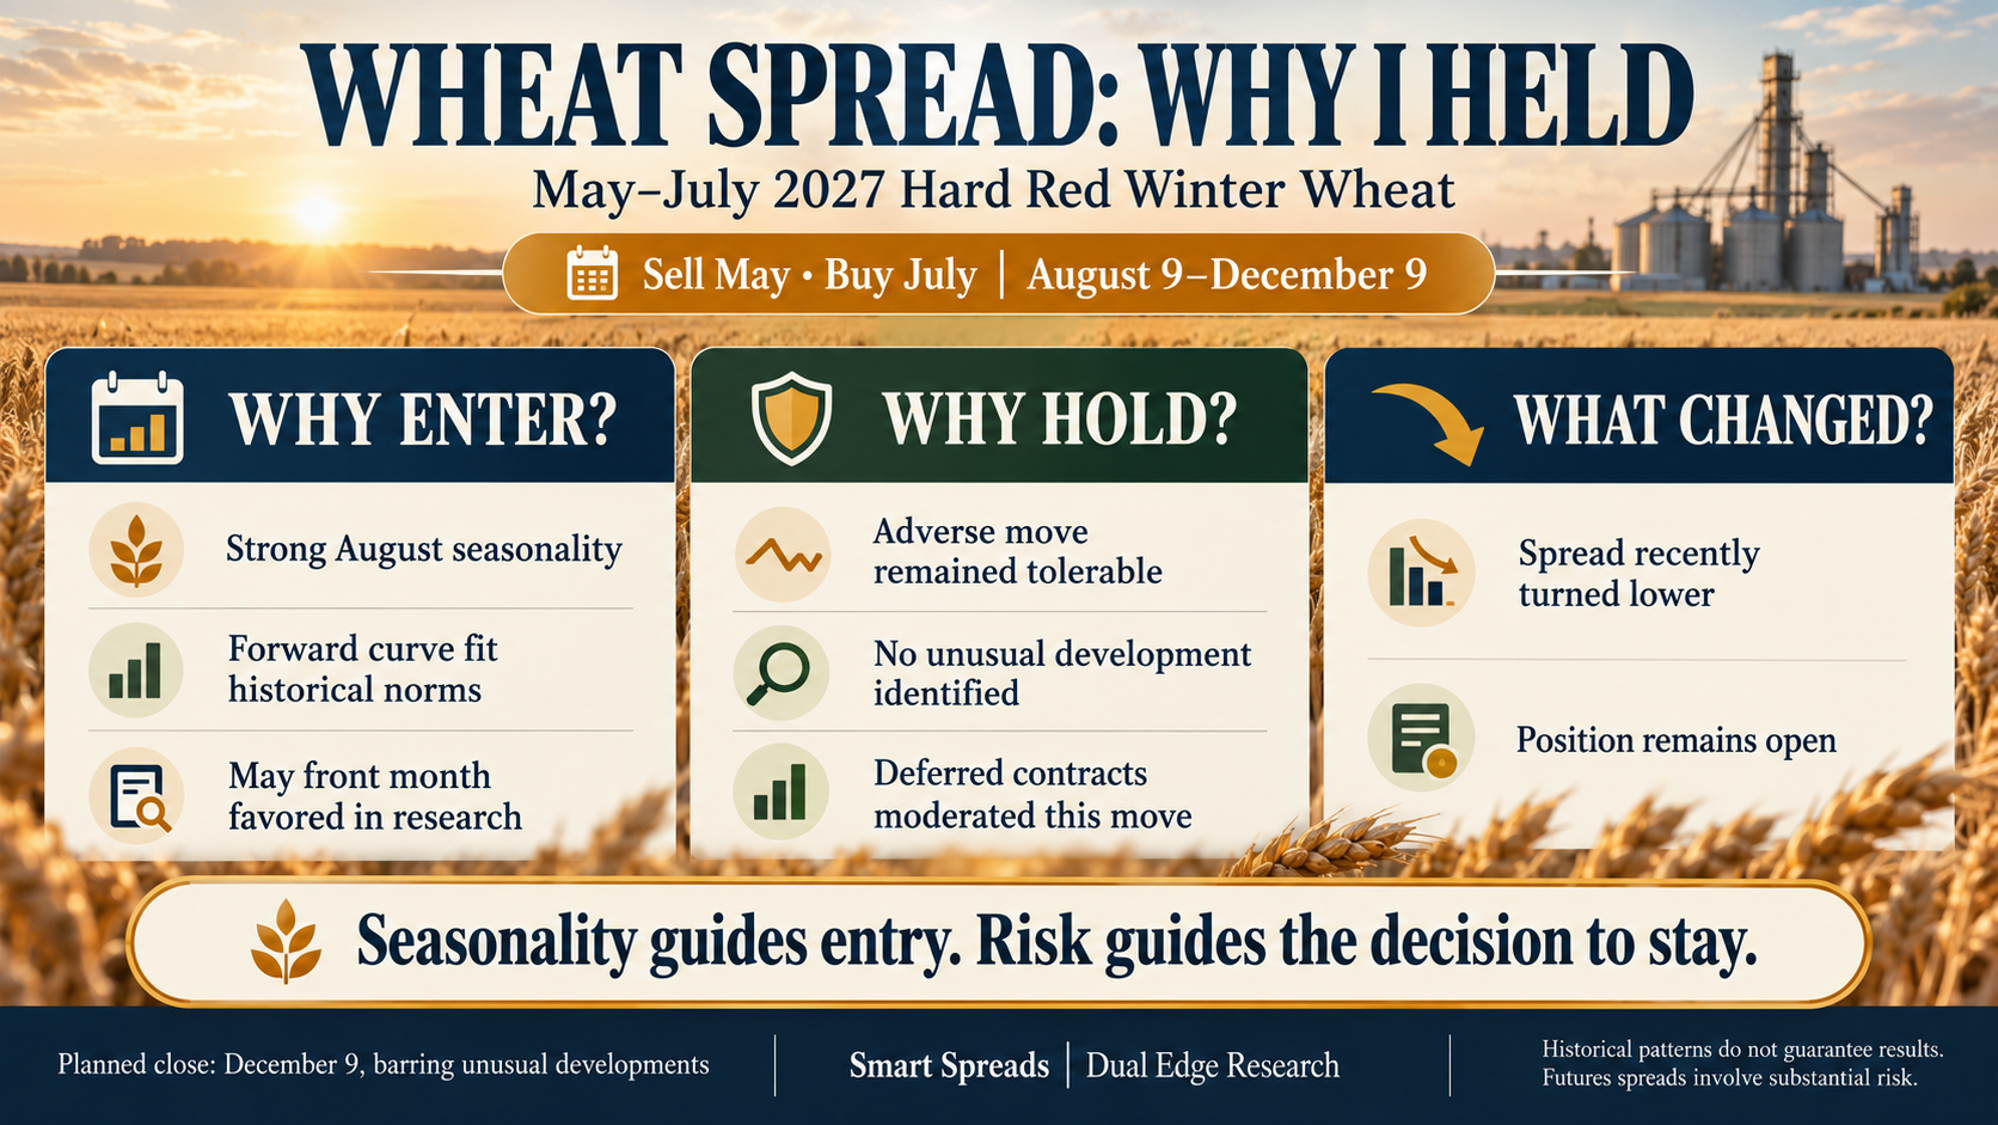
On August 9, I entered the May–July 2027 Hard Red Winter Wheat spread because three elements supported the opportunity.
- Historical research showed strong performance for this seasonal spread when initiated in early to mid-August.
- The forward curve at entry was consistent with historical norms.
- Comparisons of contract combinations had consistently favored May as the front month. Together, those findings supported selling May wheat and buying July wheat, with a scheduled close of December 9.
The Trade and the Seasonal Expectation
The position is a short May–July 2027 Hard Red Winter Wheat calendar spread: sell the May contract and buy the July contract. The chart displays May minus July, identified as KWK27–KWN27. A decline in that difference benefits the short spread; an increase works against it. This trade is in the relationship between two delivery months. Wheat prices can rise or fall while the spread behaves differently, depending on which contract moves more. The chart’s five-year and fifteen-year seasonal patterns generally slope lower through the August–December window. Those historical averages provided context for the trade. They did not guarantee either a profitable result or a smooth decline. The expectation was that the price difference between the two contracts would decline during that window. Instead, the spread initially moved sharply higher, working against the position. That raised the practical question at the center of this article: had the evidence supporting the trade changed enough to justify an early exit, or did the position still fit the original plan?
The First Chart: A Move Against the Trade
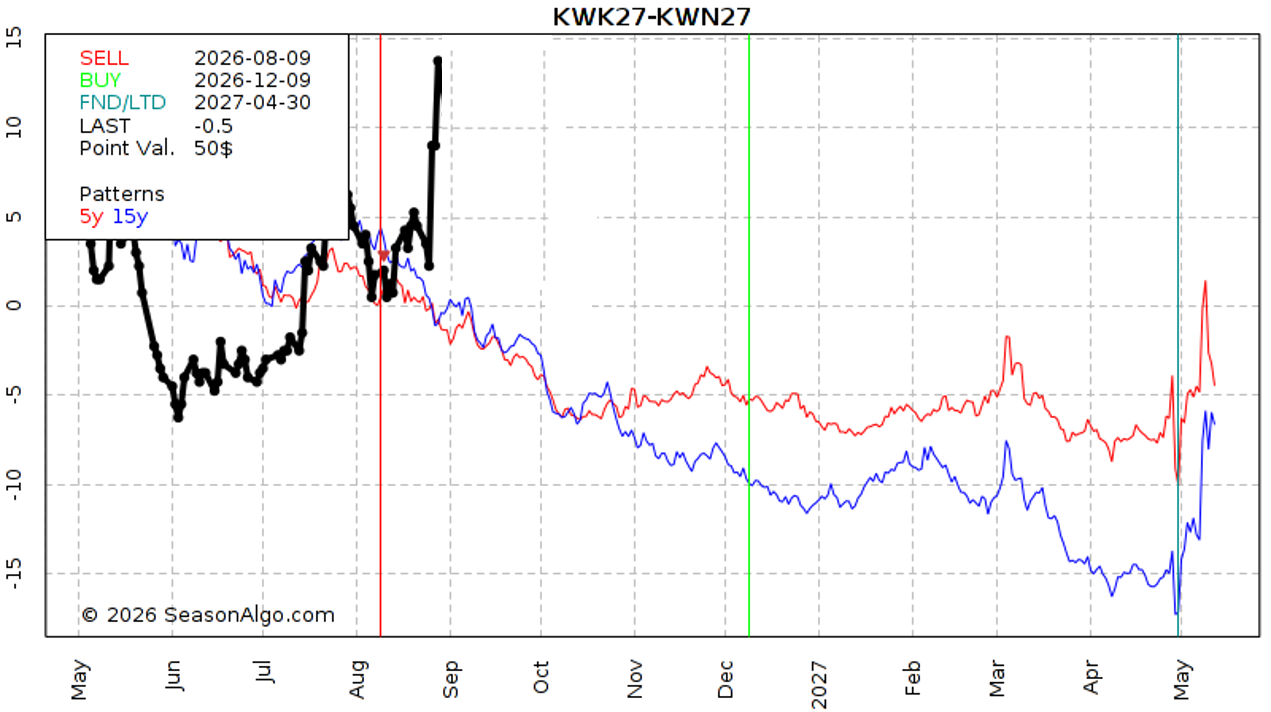
Chart 1: Black: current spread; red: five-year seasonal pattern; blue: fifteen-year pattern. Source: SeasonAlgo.com, supplied by the author.
Initially, the current spread’s black line climbs sharply toward +14 while the five-year and fifteen-year seasonal patterns generally move lower. The gap between expectation and current behavior is clear. Because this is a short spread, that rise works against the position. It deserves attention. But the chart alone does not tell us whether the loss is unacceptable, whether conditions have materially changed, or whether an early exit is warranted. Those were the questions I needed to answer while the position was under pressure.
Three Reasons I Continued Holding
First, the negative move was not large enough to signal an early exit. I evaluated the drawdown against the position’s risk rather than treating every unfavorable price change as a reason to close. In this case, the move did not justify deviating from the planned holding period.
Second, I saw nothing suggesting that the move represented an unusual development requiring action. I assessed it as ordinary market behavior. The original seasonal window was still open, and the unfavorable movement alone did not establish that the trade’s reasoning had materially changed.
Third, both contracts were well out on the forward curve. The May and July 2027 delivery months were several months beyond the August entry. In this trade, I judged that distance had moderated the spread’s movement, making the drawdown relatively manageable.
That is an observation about this position, not a rule that deferred spreads always move less. Farther-out contracts can still move substantially. Here, however, these two contracts' behavior made it relatively easy to stay in the trade.
The Second Chart: The Spread Turns Lower
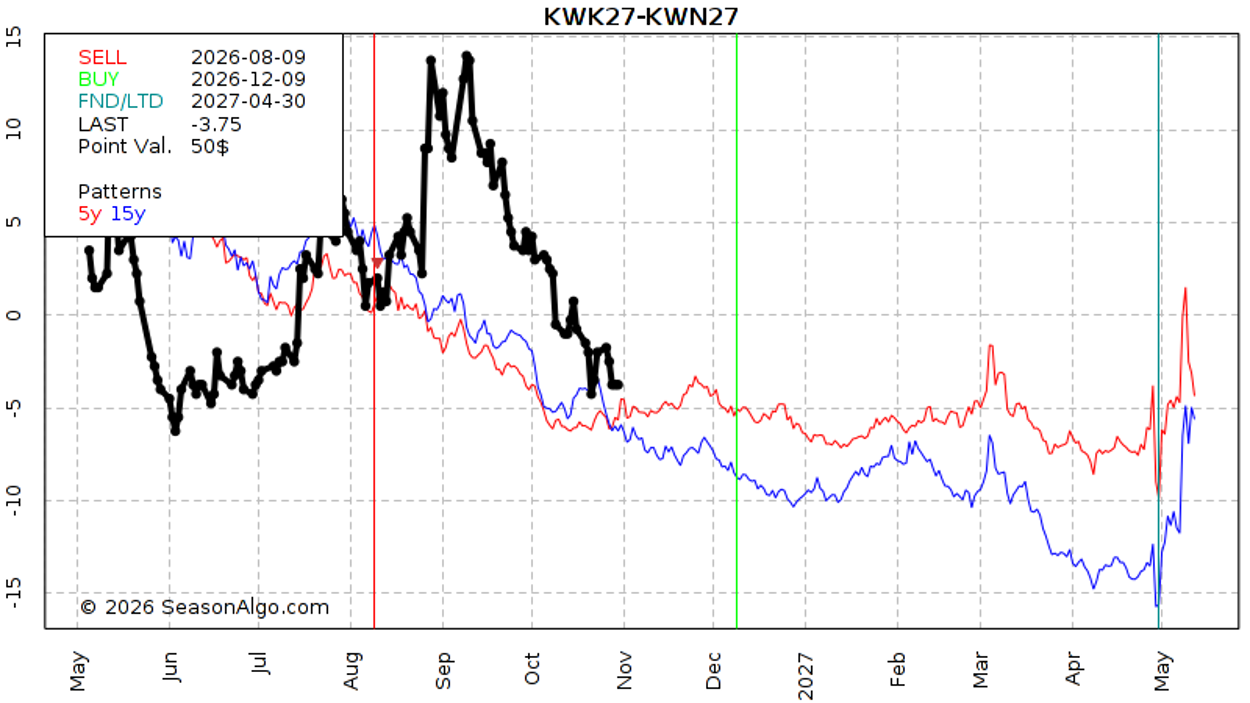
Chart 2: After the recent reversal. Black: current spread; red: five-year seasonal pattern; blue: fifteen-year pattern. Source: SeasonAlgo.com, supplied by the author.
Now consider the current chart. After the sharp rise and subsequent fluctuations, the black line has fallen back below zero, with the latest reading at -3.75. That decline favors the short spread and brings its direction back toward the historical seasonal tendency. It reinforces the distinction between the expected direction and the trade's actual path. The current line still does not match the historical averages, and the position’s final result remains unknown. The reversal is welcome, but that information wasn't available when I chose to hold. The earlier decision rested on a tolerable adverse move, no identified unusual development requiring action, and considerable time remaining in the seasonal window. This example does not establish that every seasonal trade will recover. Historical averages combine different individual paths; a favorable tendency can still produce a losing trade. A subsequent recovery cannot substitute for sound risk assessment at the time of the decision.
The Plan From Here
I remain in the position and expect to close on December 9, barring unusual developments. The reversal has not changed that scheduled date. I will continue monitoring the spread. A material change in conditions or an unacceptable increase in risk could still justify closing earlier. Sticking to a plan requires ongoing evaluation; it does not mean ignoring new evidence. This wheat example illustrates a useful distinction: seasonality helps identify an opportunity, while risk assessment determines whether the account can remain with it. The market’s path may be uncomfortable even when the original reasoning remains intact. In this case, the evidence supported holding through the detour. The recent turn is welcome, but the trade remains open, and its final result is still ahead.
About Smart Spreads
Smart Spreads examines seasonal commodity futures relationships and the conditions surrounding each trade. Learn more at www.BullStrangle.com.
Disclosure: This article describes an open position and the author’s assessment, not a recommendation. Futures spreads involve substantial risk. Historical seasonal patterns do not guarantee future results.
Additional Details
Dual Edge Research publishes 2 weekly newsletters offered at one low price:
- The Bull Strangle Newsletter focuses on stocks and options, combining stock ownership with disciplined option-selling techniques designed to generate consistent income while managing risk.
- The Smart Spreads Newsletter focuses on seasonal commodity spreads, a historically proven approach that seeks opportunities across agricultural, energy, metal, and financial futures markets.
Each strategy is designed to stand on its own, but together they provide a diversified approach that can perform across a wide range of market environments. For traders looking to deepen their education, The Bull Strangle Strategy and Trading Commodity Spreads are both available on Amazon.
Visit BullStrangle.com to subscribe for just $1 for the first month.
For a video overview of the Bull Strangle Newsletter
For a video overview of the Smart Spreads Newsletter
Darren Carlat
Dual Edge Research
(214) 636-3133
DualEdgeResearch@gmail.com
Disclaimer
This information is for informational purposes only and should not be considered investment advice. Past performance is not indicative of future results, and all investments carry inherent risk. Consult with a financial advisor before making any investment decisions.