


EN
UFP Industries (UFPI) After Earnings Pressure Tests Whether The Stock Is Still Undervalued
UFP Industries (UFPI) just put fresh numbers on the table, with third quarter results showing higher sales but softer earnings as freight and energy costs pressured profitability and tested the current full year outlook.
The earnings release has arrived after a choppy stretch for UFP Industries, with the share price at $81.90 and a 30-day share price return of 6.06% partially offsetting a year-to-date share price decline of 11.15% and a 1-year total shareholder return that is down 9.67%.
Compare UFP Industries' cost pressures and earnings reset with other manufacturers by scanning our hand picked list of solid balance sheet and fundamentals (25 results) that may be handling volatility with more resilient finances.
UFP Industries now trades well below both analyst targets and an intrinsic value estimate, after a choppy year in the share price. So where does a fair valuation really land in that gap?
Price-to-Earnings of 20.4x: Is it justified?
On simple valuation math, UFP Industries trades on a P/E of 20.4x, which lines up as inexpensive compared with both peers and the broader US Building industry even after a tough share price run.
The P/E ratio compares the current share price with earnings per share, so for UFP Industries it reflects what the market is willing to pay today for each dollar of profit. For a manufacturer with cyclical exposure, this measure gives a quick read on how investors are pricing in current earnings power relative to others in the same space.
Here, the stock trades on a P/E of 20.4x against a peer average of 43.9x and an industry average of 21.6x. This is a strong relative discount if earnings quality holds and recent profit pressure stabilises. That gap to peers also sits close to an estimated fair P/E of 20.7x, a level the market could reasonably move toward if sentiment normalises.
Relative to the US Building industry, that puts UFP Industries on a materially lower earnings multiple. This points to the market assigning a cheaper tag to its current profit stream than both direct competitors and the fair ratio suggest.
Explore the SWS fair ratio for UFP Industries.
Result: Preferred multiple of Price-to-Earnings of 20.4x (UNDERVALUED)
Still, persistent freight and energy costs, or further weakness in UFP Industries' multi year total returns, could keep that valuation gap from closing quickly.
Find out about the key risks to this UFP Industries narrative.
Another view on UFP Industries using cash flows
There is a very different message coming from our DCF work on UFP Industries. At $81.90, the stock sits about 30.7% below an estimated future cash flow value of $118.17, which frames the same earnings story as a potential discount rather than just a lower P/E. So which lens do you trust more when cash flows and multiples disagree?
Look into how the SWS DCF model arrives at its fair value.
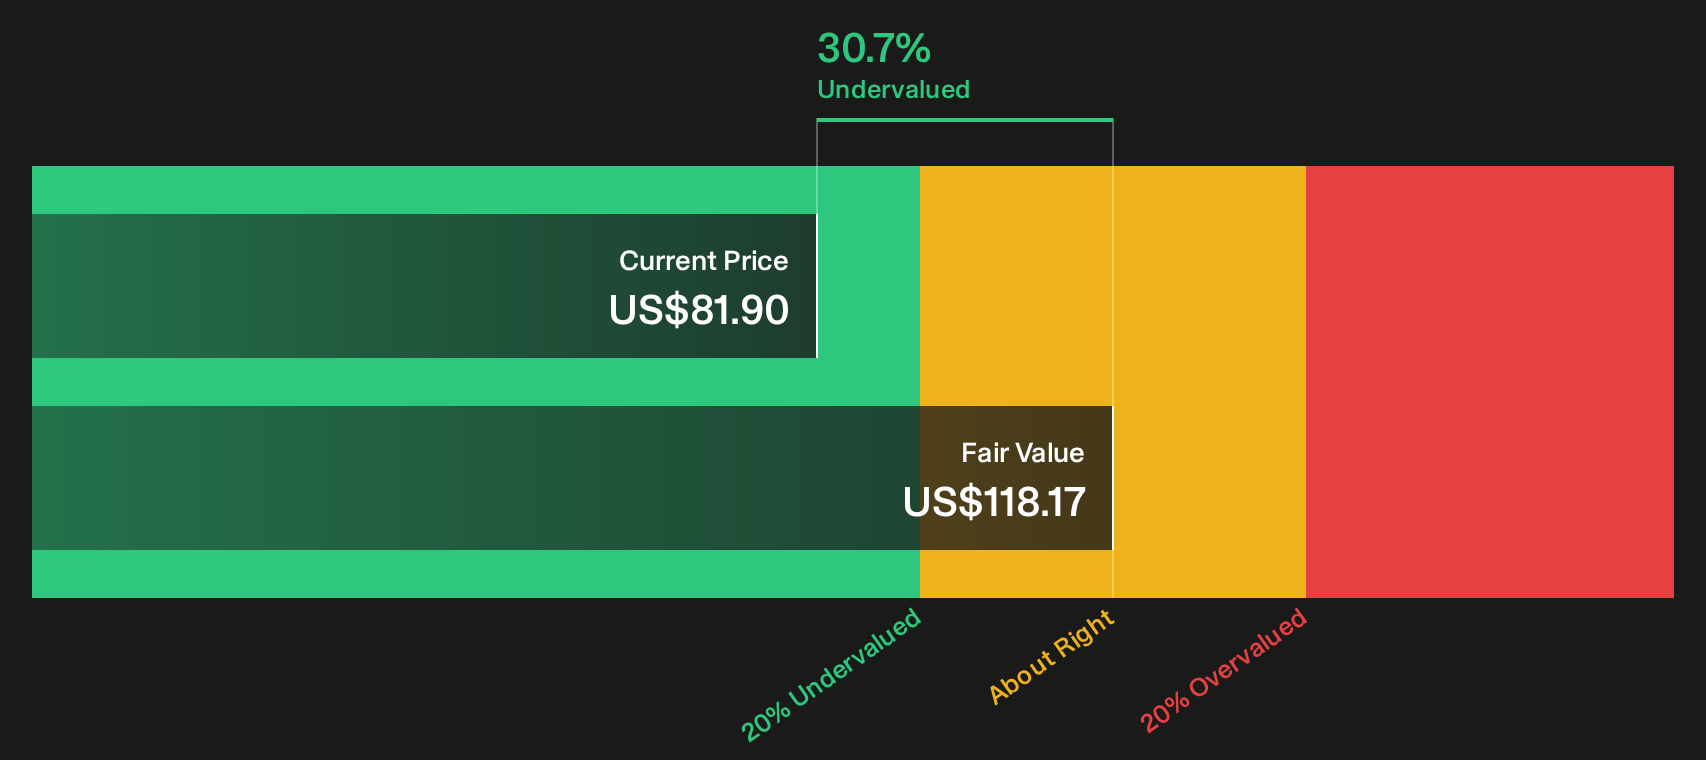
Simply Wall St performs a discounted cash flow (DCF) on every stock in the world every day (check out UFP Industries for example). We show the entire calculation in full. You can track the result in your watchlist or portfolio and be alerted when this changes, or use our stock screener to discover 29 high quality undervalued stocks. If you save a screener we even alert you when new companies match - so you never miss a potential opportunity.
Next Steps
Curious whether the mix of softer earnings and a discounted P/E really adds up in your view? Move quickly, analyze the numbers in detail, and pressure test the optimistic signals by checking the 4 key rewards
Looking for more investment ideas beyond UFP Industries?
If UFP Industries has sharpened your focus on valuation and resilience, do not stop here. Broaden your watchlist now or risk missing sharper opportunities.
- Target potential mispricing by scanning the 29 high quality undervalued stocks that match strong fundamentals with restrained expectations.
- Prioritize income resilience by reviewing the 5 dividend fortresses that pair higher yields with balance sheet support.
- Dial down portfolio stress by filtering for the 30 resilient stocks with low risk scores that score well on financial strength and stability.
Have feedback on this article? Concerned about the content? Get in touch with us directly. Alternatively, email editorial-team@simplywallst.com