


EN
Civista Bancshares And 2 Additional Stocks That May Be Priced Below Their Estimated Value
The United States market has remained flat over the last week but has experienced a 10% increase over the past year, with earnings projected to grow by 17% annually. In such a climate, identifying stocks that may be priced below their estimated value can offer potential opportunities for investors seeking to capitalize on future growth prospects.
Top 10 Undervalued Stocks Based On Cash Flows In The United States
| Name | Current Price | Fair Value (Est) | Discount (Est) |
| Zions Bancorporation National Association (ZION) | $66.23 | $121.39 | 45.4% |
| Provident Financial Services (PFS) | $23.17 | $42.55 | 45.5% |
| OP Bancorp (OPBK) | $15.44 | $29.95 | 48.4% |
| Noah Holdings (NOAH) | $6.89 | $13.25 | 48% |
| Meta Platforms (META) | $624.52 | $1161.95 | 46.3% |
| Halliburton (HAL) | $35.90 | $66.38 | 45.9% |
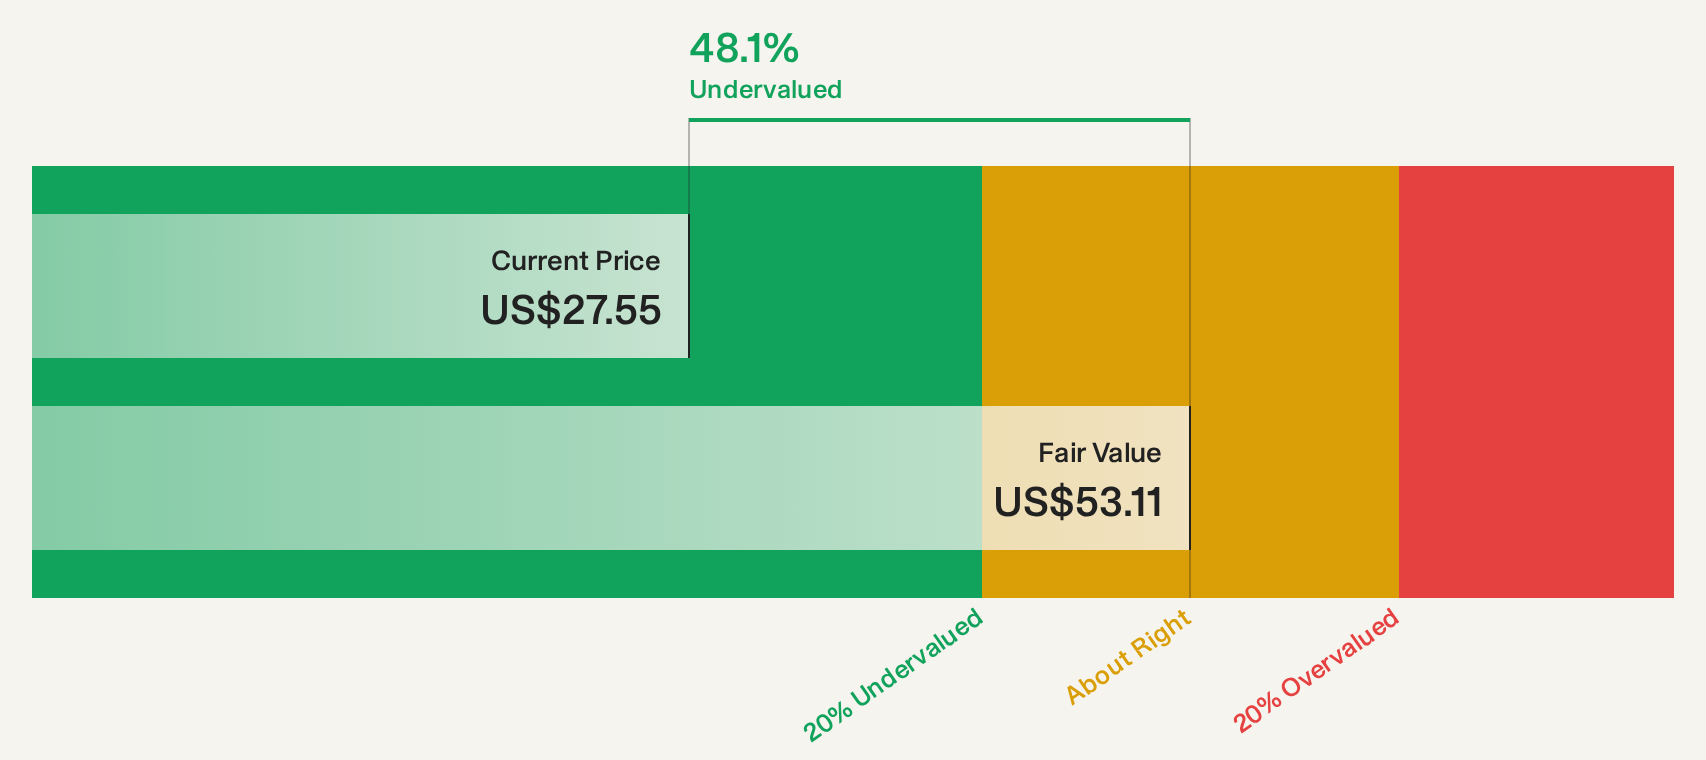
| Civista Bancshares (CIVB) | $28.47 | $56.56 | 49.7% |
| Atlantic Union Bankshares (AUB) | $39.73 | $78.92 | 49.7% |
| Associated Banc-Corp (ASB) | $30.53 | $57.52 | 46.9% |
| Alphabet (GOOGL) | $283.82 | $522.00 | 45.6% |
Let's dive into some prime choices out of the screener.
Civista Bancshares (CIVB)
Overview: Civista Bancshares, Inc. is the financial holding company for Civista Bank, offering banking services in the United States with a market cap of approximately $589.67 million.
Operations: The company generates revenue primarily through its banking services, amounting to $187.25 million.
Estimated Discount To Fair Value: 49.7%
Civista Bancshares is trading at US$28.47, significantly below its estimated future cash flow value of US$56.56, suggesting undervaluation based on discounted cash flow analysis. Despite a reliable dividend yield of 2.53%, its earnings growth forecast at 4.5% annually lags behind the broader U.S. market's expected growth rate of 17.1%. Recent earnings reports show net income and interest income increases, yet revenue growth projections remain modest compared to industry averages.
- Our growth report here indicates Civista Bancshares may be poised for an improving outlook.
- Get an in-depth perspective on Civista Bancshares' balance sheet by reading our health report here.
Franklin Electric (FELE)
Overview: Franklin Electric Co., Inc. designs, manufactures, and distributes water and fuel pumping systems across various regions including the United States, Canada, Latin America, Europe, the Middle East, Africa, and the Asia Pacific with a market cap of approximately $4.27 billion.
Operations: Franklin Electric's revenue is primarily derived from its water and fuel pumping systems, which are distributed across multiple regions including the United States, Canada, Latin America, Europe, the Middle East, Africa, and the Asia Pacific.
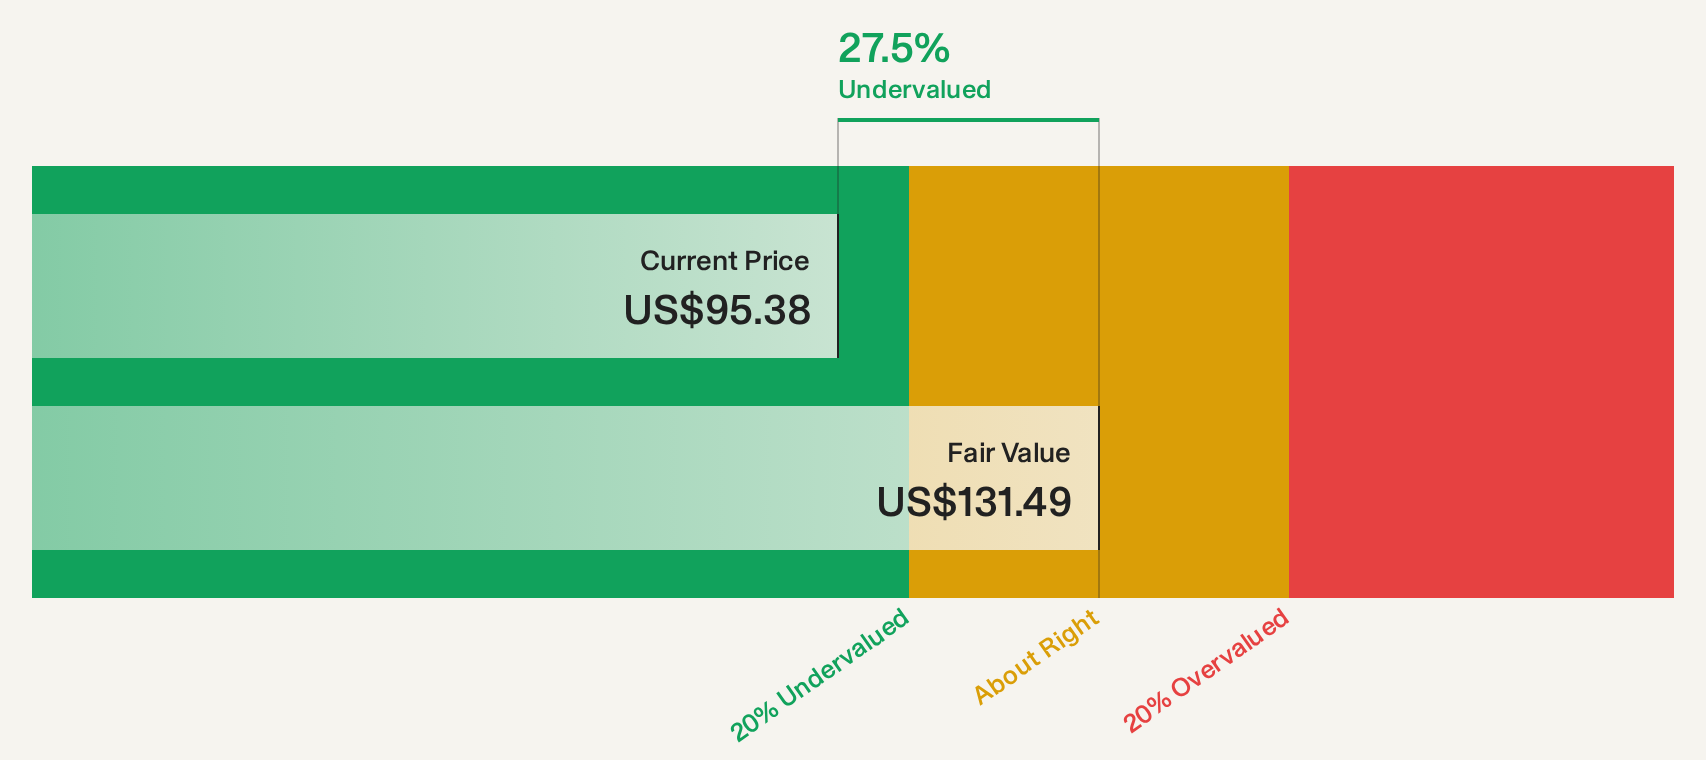
Estimated Discount To Fair Value: 25.8%
Franklin Electric is trading at US$96.74, below its estimated future cash flow value of US$130.32, highlighting potential undervaluation based on discounted cash flow analysis. The company recently raised its full-year 2026 earnings guidance, with third-quarter sales reaching US$633.62 million and net income rising significantly to US$60.65 million from the previous year. Despite forecasted annual earnings growth of 14.59%, it lags behind the broader U.S. market's expected rate of 17.1%.
- Upon reviewing our latest growth report, Franklin Electric's projected financial performance appears quite optimistic.
- Take a closer look at Franklin Electric's balance sheet health here in our report.
Graco (GGG)
Overview: Graco Inc. designs, manufactures, and markets systems and equipment for handling fluid and powder materials across various regions globally, with a market cap of approximately $10.77 billion.
Operations: The company's revenue segments include Contractor at $1.10 billion, Expansion Markets at $170.78 million, and Industrial (including Process) at $1.04 billion.
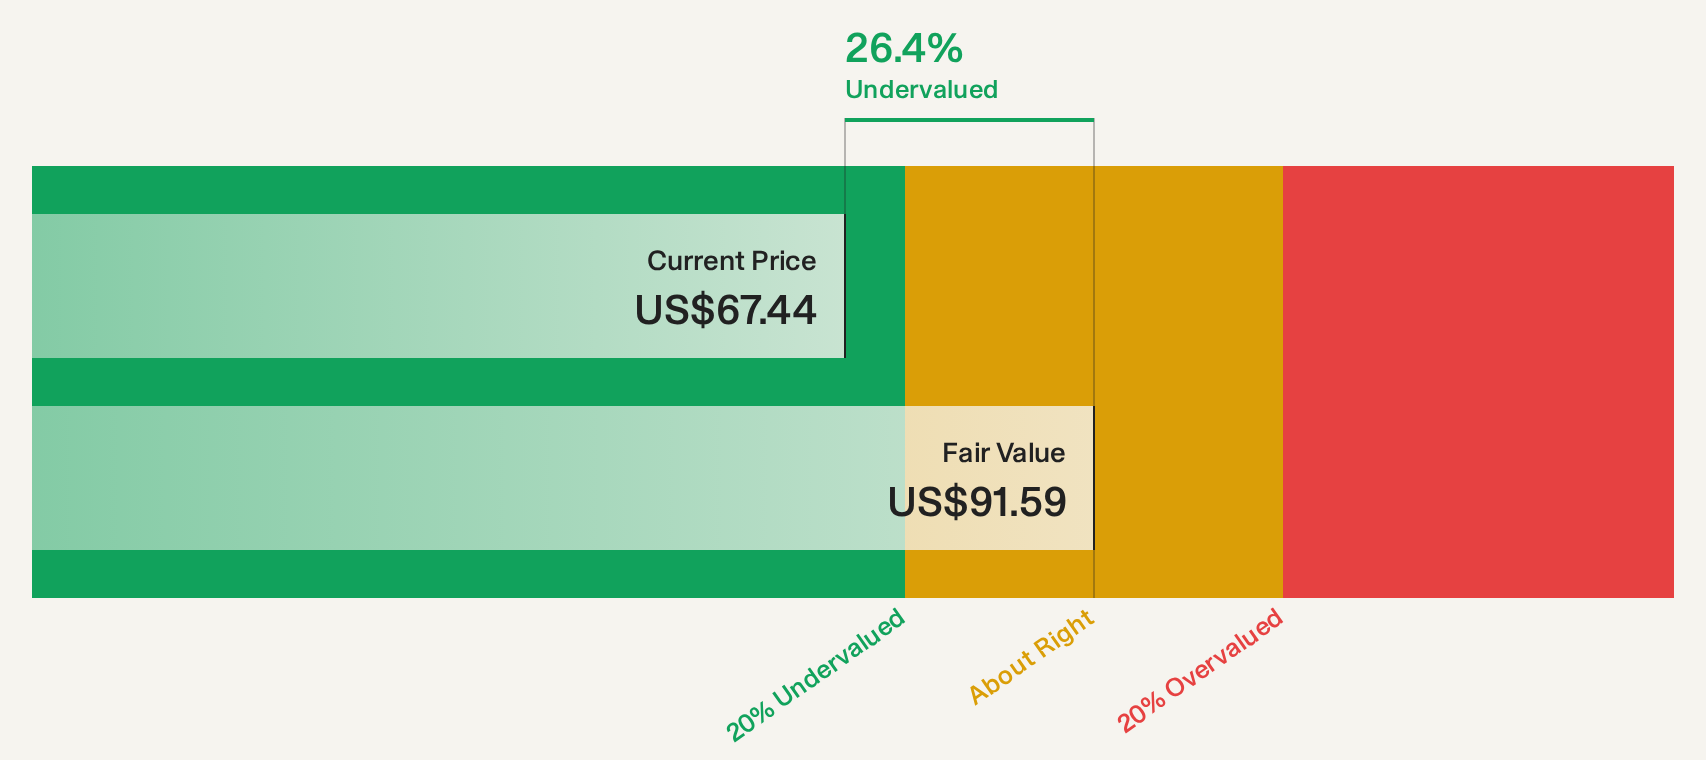
Estimated Discount To Fair Value: 24.3%
Graco is trading at US$68.75, below its estimated future cash flow value of US$90.79, indicating potential undervaluation. Recent earnings show third-quarter sales increased to US$586.39 million, but net income decreased to US$121.56 million year-over-year. The company forecasts fourth-quarter revenue between US$610 million and US$640 million, with slower earnings growth compared to the U.S. market average yet maintaining a reliable 1.72% dividend yield amidst these dynamics.
- The growth report we've compiled suggests that Graco's future prospects could be on the up.
- Navigate through the intricacies of Graco with our comprehensive financial health report here.
Key Takeaways
- Click here to access our complete index of 82 Undervalued US Stocks Based On Cash Flows.
- Already own these companies? Bring clarity to your investment decisions by linking up your portfolio with Simply Wall St, where you can monitor all the vital signs of your stocks effortlessly.
- Maximize your investment potential with Simply Wall St, the comprehensive app that offers global market insights for free.
Seeking Other Investments?
- Explore high-performing small cap companies that haven't yet garnered significant analyst attention.
- Diversify your portfolio with solid dividend payers offering reliable income streams to weather potential market turbulence.
- Fuel your portfolio with companies showing strong growth potential, backed by optimistic outlooks both from analysts and management.
This article by Simply Wall St is general in nature. We provide commentary based on historical data and analyst forecasts only using an unbiased methodology and our articles are not intended to be financial advice. It does not constitute a recommendation to buy or sell any stock, and does not take account of your objectives, or your financial situation. We aim to bring you long-term focused analysis driven by fundamental data. Note that our analysis may not factor in the latest price-sensitive company announcements or qualitative material. Simply Wall St has no position in any stocks mentioned.
Have feedback on this article? Concerned about the content? Get in touch with us directly. Alternatively, email editorial-team@simplywallst.com