


EN
Radian Group (RDN) Reshapes Leadership, Is The Discount Still Too Wide?
Leadership changes put Radian Group’s direction in focus
Radian Group (RDN) just reshaped its senior team, naming long-time insider Dan Kobell as Chief Financial Officer and appointing Courtney Smith Goodrich as Chief Information Officer to drive finance and technology priorities.
Radian Group’s leadership reshuffle comes at a time when the 1 month share price return of 8.95% and a 1 day move of 2.06% suggest short term momentum is picking up. At the same time, the 1 year total shareholder return of 8.88% and 5 year total shareholder return of 90.10% indicate a longer track record that recent weakness in the 3 month share price return, which fell 8.49%, has not erased.
Spot shifts like Radian Group’s leadership reset early by scanning our hand picked 18 high quality undiscovered gems that pair solid fundamentals with under the radar stories.
Bulls point to Radian Group’s track record and fresh leadership, while bears focus on recent share price weakness and sector risk. Which story does the current valuation lean toward as investors weigh the next leg?
Price-to-Earnings of 8.4x: Is it justified?
Valuation looks supportive for Radian Group at a P/E of 8.4x, especially when you line that up with the last close at $35.68 and the broader read that the shares are trading at a discount to some benchmarks.
The P/E ratio compares what investors pay today for each dollar of earnings, which matters for a financial services group that relies on profit resilience. For Radian Group, that 8.4x figure reflects a business with high quality earnings but with profit margins that are currently at 33.9%, below the 53.1% level reported last year, and with earnings that have declined by 1.1% per year over the past 5 years.
Context against peers sharpens the picture. The same 8.4x P/E is below the US Diversified Financial industry average of 17x and slightly below the peer average of 8.8x. It is also under an estimated fair P/E of 10.4x that the market could move towards if sentiment and fundamentals align more closely.
Explore the SWS fair ratio for Radian Group.
Result: Price-to-Earnings of 8.4x (UNDERVALUED)
Still, the recent 3 month share price decline of 8.49% and Radian Group’s reliance on the US housing and mortgage cycle could easily challenge the current bullish view.
Find out about the key risks to this Radian Group narrative.
Another view on Radian Group’s value
The P/E story points one way, but the SWS DCF model pushes far harder, with an estimated future cash flow value of $113.93 versus the current $35.68 share price. That gap signals a very different level of undervaluation. Which signal do you treat as the anchor when you size a position?
Look into how the SWS DCF model arrives at its fair value.
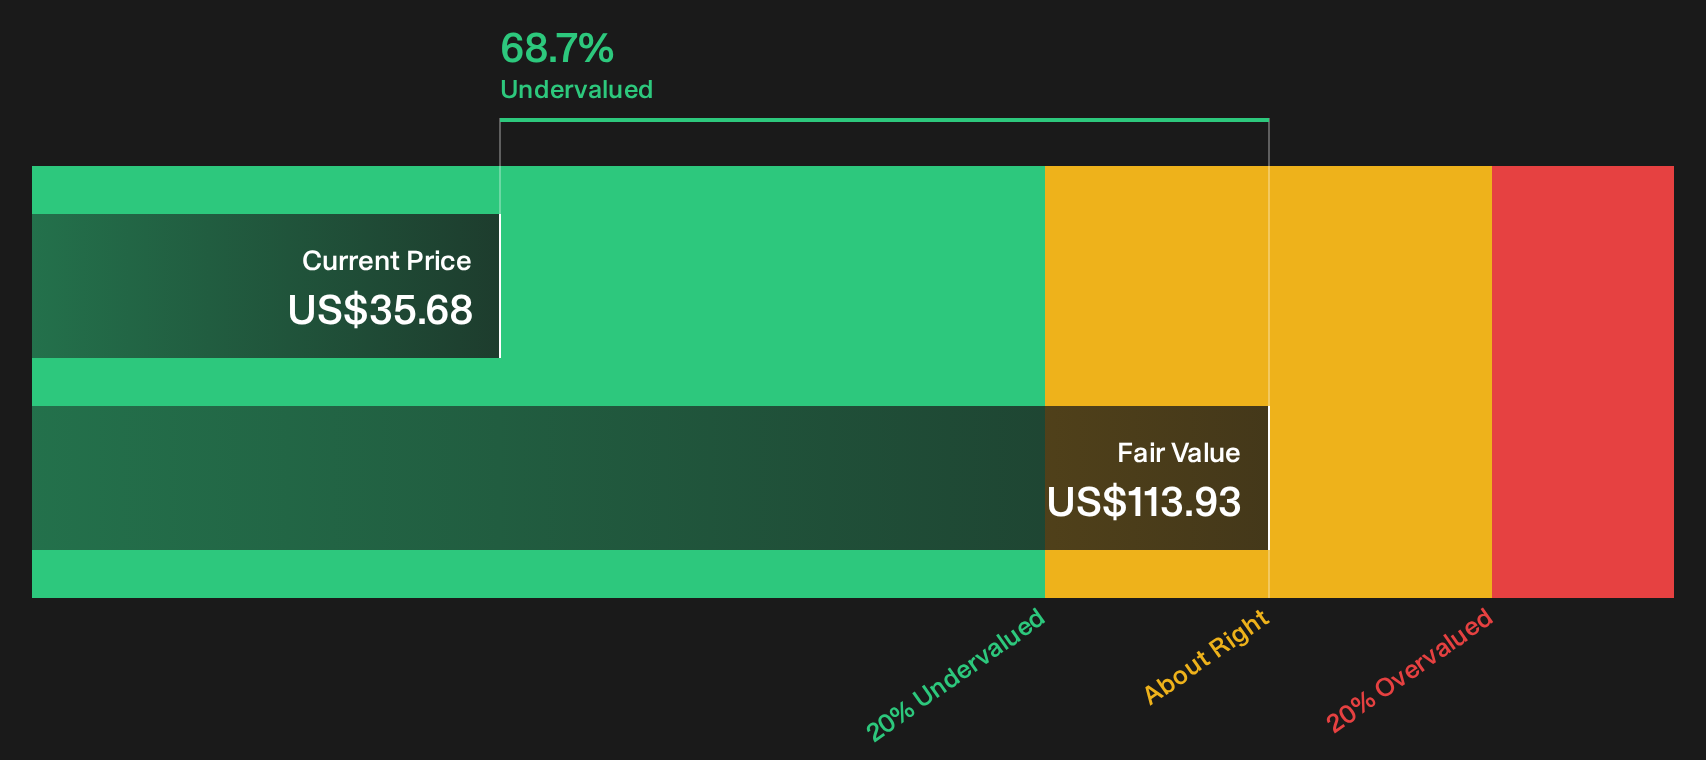
Simply Wall St performs a discounted cash flow (DCF) on every stock in the world every day (check out Radian Group for example). We show the entire calculation in full. You can track the result in your watchlist or portfolio and be alerted when this changes, or use our stock screener to discover 30 high quality undervalued stocks. If you save a screener we even alert you when new companies match - so you never miss a potential opportunity.
Next Steps
Mixed signals on Radian Group so far. If you want to move quickly and form your own stance, start by weighing the 5 key rewards and 1 important warning sign.
Looking for more Radian Group style investment ideas?
If you only stop at Radian Group, you risk missing other setups where price, quality, and risk come together in a way that suits your playbook.
- Target resilient compounding potential by scanning companies that look undervalued on quality and fundamentals through the 30 high quality undervalued stocks.
- Lock in income-focused candidates by reviewing a curated set of cash generating businesses in the 7 dividend fortresses.
- Prioritise capital protection by filtering for companies with stronger balance sheets and cleaner fundamentals via the list of solid balance sheet and fundamentals (23 results).
Have feedback on this article? Concerned about the content? Get in touch with us directly. Alternatively, email editorial-team@simplywallst.com