


EN
Xiaomo: AI stocks ushered in a record influx of retail investors to bottom-up capital into leveraged ETFs
The Zhitong Finance App learned that in the “Flows & Liquidity” report on October 28, J.P. Morgan's global market strategy team gave a set of consistent evidence: in the past two weeks, retail capital inflows into equity funds have accelerated. Among them, capital inflows to leveraged stock ETFs this month hit the highest level on record. It is this money that supports the bottom of AI-related stocks.
The report, led and signed by Nikolaos Panigirtzoglou, condenses the conclusion into one sentence: retail investors invested record capital into leveraged ETFs, supporting the bottom of AI-related stocks; retail investors' impulse still had room to strengthen until the end of the year, especially through options; the QQQ shorting ratio rose to the highest level since 2023, which meant that institutional investors had a short base to be recovered; technology companies' capital expenditure rose sharply this year, but the resilience of buybacks exceeded expectations, providing additional background support for the stock market.
Leveraged ETF: Falling out of space first, then being filled
The chart shows that capital flows from global equity funds have accelerated markedly in the past two weeks, led by leveraged stock ETFs. This month's capital inflow into this type of product is “the strongest in recorded history.”
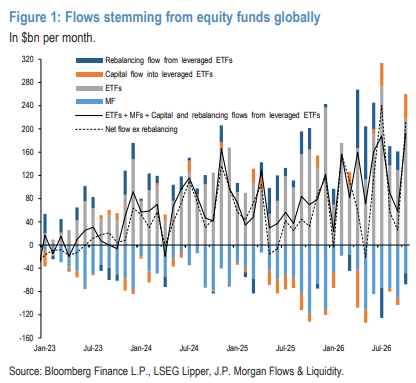
The point is what happened before. According to the report, there has been a further significant decline in the asset management scale (AUM) of leveraged stock ETFs in the past few weeks. Among them, the AUM of leveraged storage stock ETFs fell to the lowest level since late May, erasing about two-thirds of the April and May rounds of gains. AUM is at a low level, leaving room for further inflows in the short term — a direct basis for J.P. Morgan's judgment that “it can continue.”
In other words, this is not a high chase without a pullback, but a fresh increase in positions after deleveraging.
Options side: the next wave of retail investors may come from here
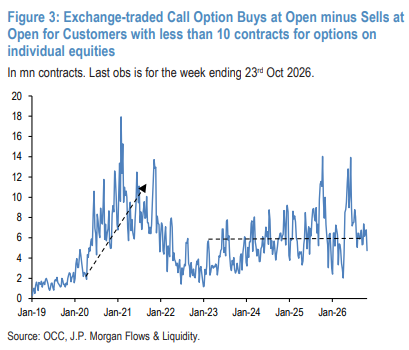
J.P. Morgan believes that there is room for retail investors' buying impulse to increase until the end of the year; the main channel is options. The figure below tracks the net amount of “open buy call options minus open sell” for small customers with positions of less than 10 contracts on a single individual stock option: this indicator has yet to reappear after the collapse of the deleveraging phase in June and July of last year. In other words, retail investors have taken the lead in original stocks and ETFs, but they haven't started to increase their positions on the options side.
Institutions: Positions have been lowered, and a short base has been built
There is also space on this side of the agency. J.P. Morgan's broad stock position index extracted from cross-asset position monitoring shows that compared to the recent peak in mid-September, current positions have declined significantly — which means that speculative funds such as hedge funds also have room to “continue to increase technology stocks from here on.”
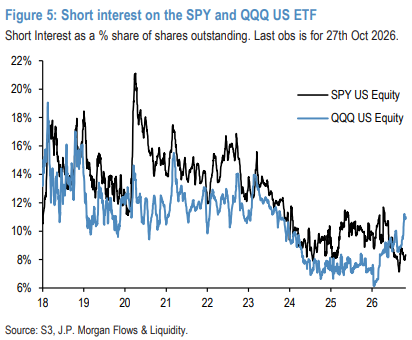
A more intuitive proof is QQQ's shorting ratio: the chart below shows that QQQ's short share of tradable shares rose to its highest level since 2023 (data as of October 27). Shortage itself is fuel — once technology stocks stabilize, demand to make up will be one of the sources of buying.
Buyback: $1.55 trillion and “unexpectedly stable”
The report takes quite a bit of time to talk about repurchases, because this is its core argument for judging that “background support is still there.” Despite a sharp increase in capital expenditure by technology companies this year, the tech sector's repurchases have shown unexpectedly resiliency since the beginning of the year; the amount of repurchase announcements worldwide has reached 1.55 trillion US dollars from year to date. After annualization at an average monthly rate, it is about 1.7 trillion US dollars for the whole year, up from last year.
Why is it still being maintained? J.P. Morgan's explanation is the financing conditions: the technology sector as a whole has a financing surplus of 400 billion US dollars this year, and financing channels are still smooth. According to its credit team's observation, high-end technology companies can now simultaneously enter the public and private debt markets, including unsecured debt, bank loans, data center project financing through SPV, and GPU asset-backed debt.
But the report also leaves a door open: the unsecured debt market has actually closed to some neocloud (emerging cloud service providers) and highly leveraged technology companies. J.P. Morgan's attitude is that such companies are neither a key part of the AI ecosystem, nor are they driving repurchases, so it is currently impossible to talk about “limited financing has affected the core” — but this may change if financing conditions are tightened.
Momentum capital: Treasury bond bears and stock bulls have closed their positions sharply, but the congestion is still there
J.P. Morgan also analyzed how trend-tracking funds (CTA equivalent momentum investors) have adjusted in recent weeks. What J.P. Morgan uses is the z-value of the momentum signal (adjusted by a 10-year to 6-month volatility ratio).
Bond market: The momentum signals for 10-year US bonds, German bonds, British bonds, and Japanese bond futures were at or near extreme values at the beginning of the month. Since then, all but German bonds have basically been reduced, and the z value has fallen to the range of -0.3 to -0.4; German bonds are still deeper, about -0.7. What is really crowded is the 10-year OAT (French Treasury Bonds) versus German bonds, with a z-value of about -2.9, which is extreme by historical standards — momentum investors are quite crowded with bears here, which can easily trigger a profit settlement or return to the average, but the report suggests that this may require a period of stabilization first.
Stock market: The retracement of semiconductors in October caused momentum signals on the stock side to fall from a high level — the S&P 500 and Nikkei 225 fell to +0.9 and +0.4, respectively, from around +1.3 in early October; the MSCI emerging market changed from a slight net increase of about +0.5 to a slight headroom of −0.2. Within Asia, KOSPI fell sharply from the beginning of July and recovered slightly to about +0.5 in late September. MSCI Taiwan was about +1.3 in early October, and the two fell to 0 and +0.4 respectively after the semiconductor pullback; HSCEI already had a slight headroom at the beginning of the month, and is currently around -0.8.
Foreign exchange market: The z-value of the US dollar against G10 currencies approached the extreme zone of +1.5 in early October, and has now fallen back to about +0.8. Taken apart, the dollar's long exposure is more driven by the euro bears — the z-value of the euro reached -2.1 in early October, and is still -1.8, and most positions were opened in September. This also means a risk of profit settlement or a return to the mean.
Energy: The z-values of crude oil and TTF natural gas declined for a while after extreme values in mid-September, but as concerns about the escalation of the Middle East conflict resurfaced, the two returned to a more extreme position — crude oil futures +1.8, TTF futures +2.6; refined oil futures remained high at around +1.6.
Summarize this section in one sentence: Momentum Capital has drastically eliminated short treasury bond futures and long stock futures, but crowded positions are still in OAT against German bonds, the euro, crude oil, and TTF.
Two branch lines: Brazil and “Bitcoin is better than gold”
After Brazil's second round of presidential elections, there was only a relatively moderate reversal in retail inflows, while institutions reduced their positions faster. CME's Ibovespa futures position agent declined further sharply after the second round; CME's Brazilian real futures positions have been rising since “Liberation Day” in April 2025, and the reduction in positions after the second round basically erased the increase after the first round. Retail investors look at the EWZ (iShares MSCI Brazil) ETF: the share increased significantly after the first round, and there was some outflow after the second round, but the price adjustment showed that the weight of the portfolio was clearly lowered. Institutions look at the EWZ short ratio: it rose in mid-September and remained high until around October 15. There was a slight recovery this week, in line with the closing direction of net long positions in stock futures.
Bitcoin vs gold: J.P. Morgan previously argued that IBIT's higher ratio of bears to GLD supports “Bitcoin beats gold”; now IBIT bears are declining and GLD bears are rising, the gap between the two has almost narrowed. Just look at the weakening of support for this indicator. However, other indicators are still biased towards Bitcoin: in terms of options, Bitcoin's hedging demand is longer lasting and rising, while gold's hedging demand is falling; in futures, gold positions have declined slightly while Bitcoin positions remain high, momentum traders are still shorting gold and maintaining a stable long exposure to Bitcoin. In addition, there are two other changes that are not good for gold — the correlation between gold and S&P 500 earnings has recently been higher than that of Bitcoin, meaning that it is more like a risky asset and decentralized value has declined; Bitcoin's six-month volatility ratio to gold fell to a record low of 1.36 times in September. Although it has rebounded to 1.5 times, it is still on a downward trend and far below the historical average, and Bitcoin's previous fluctuation disadvantage is narrowing.