


EN
Is Dynex Capital (DX) Undervalued As Third Quarter Losses Raise Fresh Questions?
Dynex Capital (DX) is back in focus after reporting a third quarter net loss of US$335.54 million, with basic and diluted loss per share from continuing operations at US$1.34, drawing fresh scrutiny to the mortgage REIT's earnings profile.
The third quarter setback has landed on a share price that has already been under pressure, with Dynex Capital’s 90 day share price return down 15.52% and the year to date share price return down 23.08%. Even so, the 3 year total shareholder return remains positive at 61.69%, suggesting near term momentum has faded while longer term holders have still seen gains.
Scan beyond Dynex Capital and see how other mortgage and income-focused plays are reacting to similar pressure by reviewing our curated list of 6 dividend fortresses
After a sharp swing into heavy losses and a double digit share price decline, Dynex Capital now sits in an awkward spot. Is that pressure already reflected in the price, or does patience offer a better entry point?
Price-to-Earnings of 6.6x: Is it justified?
On valuation terms, Dynex Capital looks cheap against its own earnings profile, with a P/E of 6.6x compared with a peer average of 12.3x and the US Mortgage REITs group at 11.7x.
The P/E ratio tells you how much investors are paying for each dollar of profit. For a mortgage REIT like Dynex Capital, this metric often reflects how the market weighs earnings quality, interest rate sensitivity, and the sustainability of the payout stream rather than growth in the traditional operating sense.
With the stock trading on a materially lower P/E than both peers and the broader Mortgage REITs sector, the market is attaching a clear discount to Dynex Capital’s earnings. Against an estimated fair P/E of 39.9x, that gap is even wider, suggesting the current pricing sits well below the level the fair ratio implies the market could move toward if sentiment and assumptions were to align with that benchmark.
Explore the SWS fair ratio for Dynex Capital.
Result: Price-to-Earnings of 6.6x (UNDERVALUED)
Still, Dynex Capital faces clear pressure if sector-wide funding costs stay elevated, or if payout expectations reset lower and income focused holders decide to exit.
Find out about the key risks to this Dynex Capital narrative.
Another view on Dynex Capital’s value
A simple earnings multiple paints Dynex Capital as cheap. The SWS DCF model adds a second lens, putting fair value at about $12.40 a share versus a $10.83 price, which indicates the stock trades at a discount. The real question is how comfortable you are with the assumptions behind that cash flow curve.
Look into how the SWS DCF model arrives at its fair value.
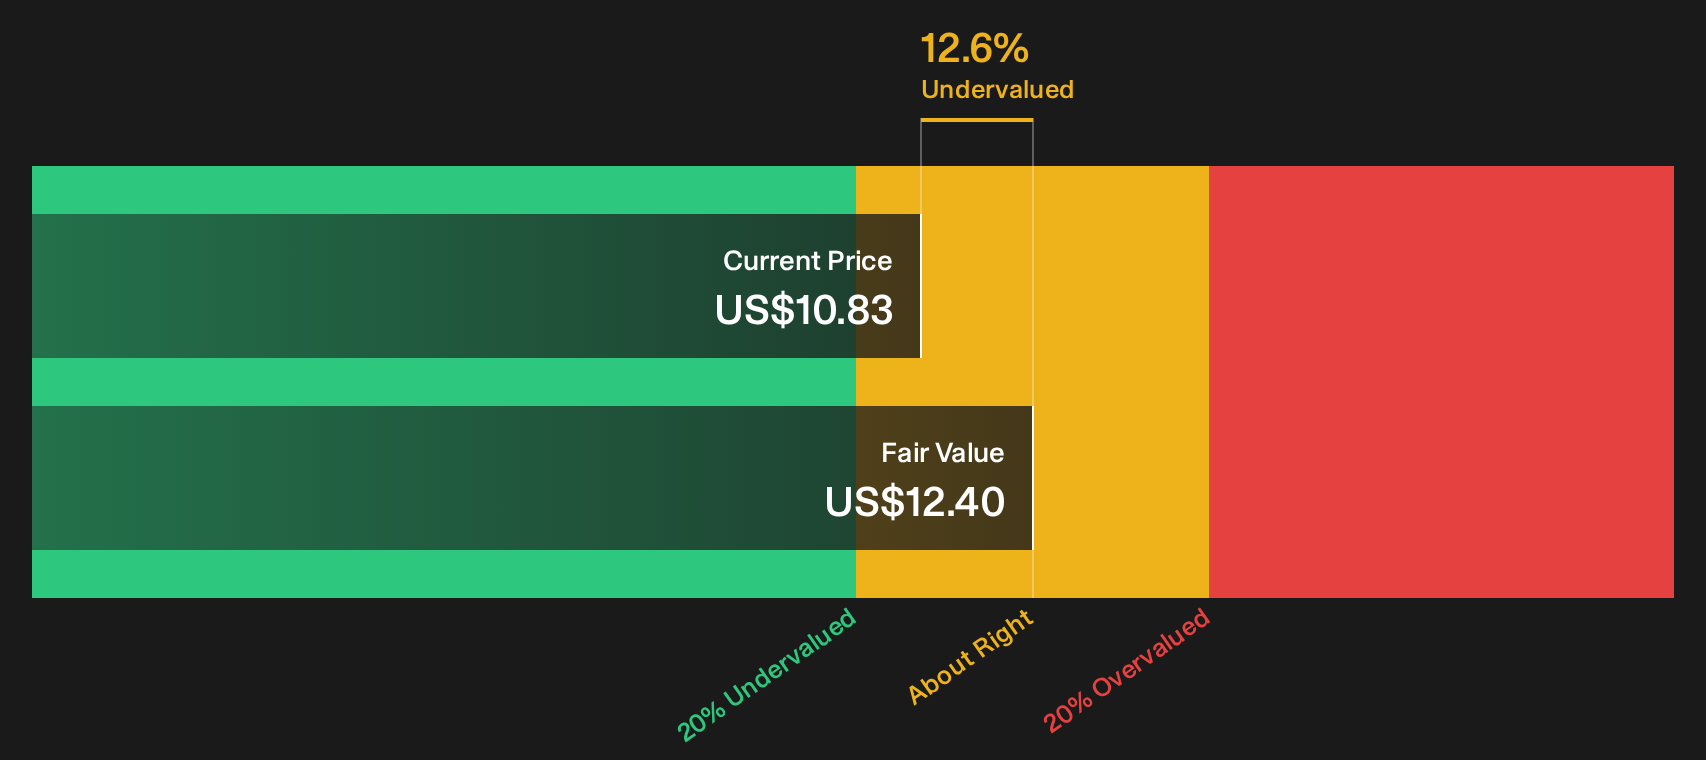
Simply Wall St performs a discounted cash flow (DCF) on every stock in the world every day (check out Dynex Capital for example). We show the entire calculation in full. You can track the result in your watchlist or portfolio and be alerted when this changes, or use our stock screener to discover 26 high quality undervalued stocks. If you save a screener we even alert you when new companies match - so you never miss a potential opportunity.
Next Steps
Mixed signals around Dynex Capital can either freeze you or push you to check the numbers yourself and decide where you stand. If you want a clear view of both the concerns and the upside that investors are watching, start with the 4 key rewards and 3 important warning signs
Looking for more investment ideas beyond Dynex Capital?
If Dynex Capital has sharpened your focus on valuation and risk, do not stop here. Use clear filters to surface opportunities that truly fit your approach.
- Target powerful upside potential by scanning a focused set of 19 high quality undiscovered gems that pair solid fundamentals with limited market attention.
- Prioritise resilience by narrowing in on 32 resilient stocks with low risk scores that carry stronger risk profiles and may offer a smoother ride through volatility.
- Strengthen your core holdings by filtering for a list of solid balance sheet and fundamentals (24 results) so you are not caught holding companies with fragile finances when conditions change.
Have feedback on this article? Concerned about the content? Get in touch with us directly. Alternatively, email editorial-team@simplywallst.com