


EN
3 Promising Penny Stocks With Market Caps Under $800M
Over the last 7 days, the market has remained flat, while in the past 12 months, it has risen by 9.2%, with earnings expected to grow by 17% per annum in the coming years. In light of these conditions, identifying stocks with strong fundamentals and growth potential is key for investors looking to capitalize on market opportunities. Penny stocks, though an outdated term, still represent smaller or less-established companies that can offer unique value propositions; we've identified three such stocks that stand out for their financial resilience and potential upside.
We're going to check out a few of the best picks from our screener tool.
Rocket Pharmaceuticals (RCKT)
Simply Wall St Financial Health Rating: ★★★★★★
Overview: Rocket Pharmaceuticals, Inc. is a late-stage biotechnology company specializing in the development, manufacturing, and sale of genetic therapies for rare and severe diseases in the United States with a market cap of $250.29 million.
Operations: Rocket Pharmaceuticals currently does not report any specific revenue segments.
Market Cap: $250.29M
Rocket Pharmaceuticals is a pre-revenue biotechnology company focusing on genetic therapies, notably for Danon disease. Recent developments include promising interim results from their pivotal Phase 2 trial of RP-A501, a gene therapy targeting cardiac function. The FDA has aligned with Rocket on the trial's recalibrated dosing protocol, which aims to support accelerated approval pathways. Financially, Rocket secured up to US$150 million in term loans to bolster its cash runway beyond three years despite being unprofitable. The management team is relatively new but backed by an experienced board and maintains sufficient assets to cover liabilities.
- Jump into the full analysis health report here for a deeper understanding of Rocket Pharmaceuticals.
- Review our growth performance report to gain insights into Rocket Pharmaceuticals' future.

UP Fintech Holding (TIGR)
Simply Wall St Financial Health Rating: ★★★★★☆
Overview: UP Fintech Holding Limited offers online brokerage services primarily for Chinese investors across New Zealand, the Cayman Islands, Singapore, the United States, and other international markets with a market cap of approximately $728.04 million.
Operations: The company generates revenue primarily from its brokerage segment, which amounts to $607.24 million.
Market Cap: $728.04M
UP Fintech Holding faces significant legal challenges due to allegations of unlicensed cross-border securities activities in China, resulting in penalties and confiscations totaling approximately US$59.7 million. Despite these hurdles, the company reported a revenue increase to US$182.27 million for Q2 2026, though net income declined compared to the previous year. The company's financial health shows resilience with short-term assets of $9.5 billion exceeding liabilities and a debt-to-equity ratio reduced significantly over five years. However, recent earnings growth has been negative, contrasting with its strong historical performance and stable weekly volatility at 6%.
- Dive into the specifics of UP Fintech Holding here with our thorough balance sheet health report.
- Examine UP Fintech Holding's earnings growth report to understand how analysts expect it to perform.

Valens Semiconductor (VLN)
Simply Wall St Financial Health Rating: ★★★★★★
Overview: Valens Semiconductor Ltd. develops semiconductor products for the audio-video and automotive industries and has a market cap of $174.33 million.
Operations: The company's revenue is derived from two segments: Automotive, which generated $20.54 million, and Cross Industry Business (CIB), contributing $51.16 million.
Market Cap: $174.33M
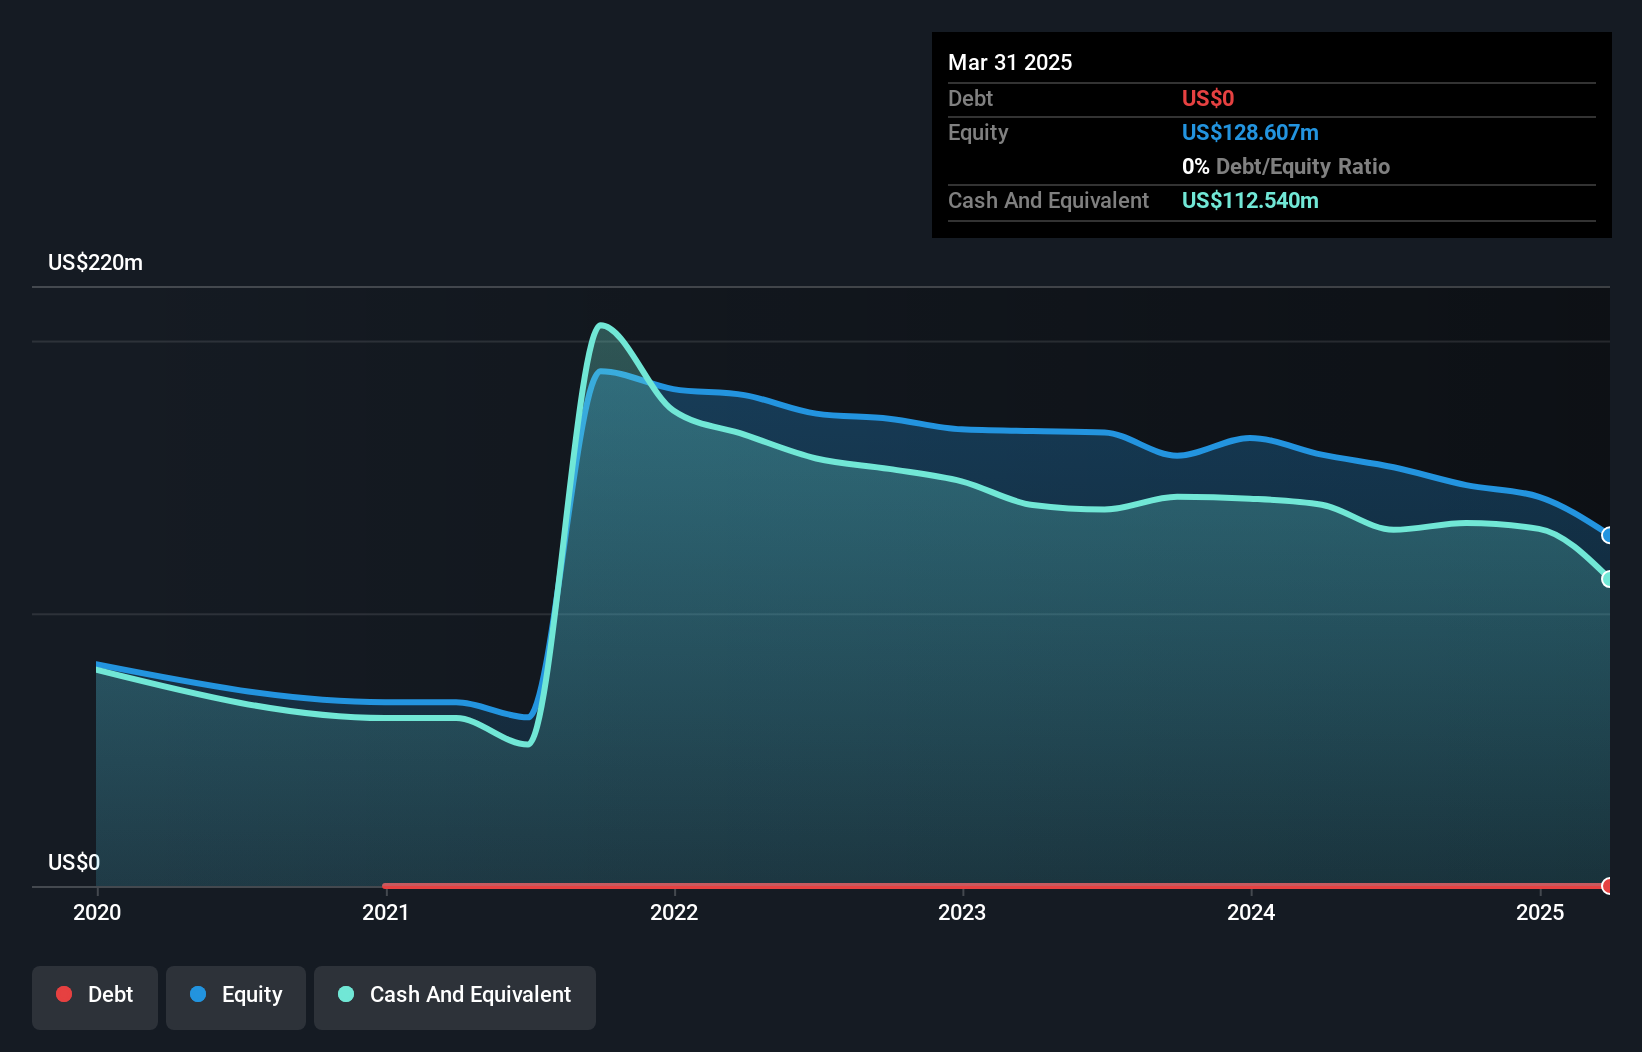
Valens Semiconductor's recent strategic alliance with Onsemi enhances its position in the automotive imaging market by integrating its connectivity technology into Onsemi's image sensors, potentially boosting royalty revenues. Despite being unprofitable, Valens has a solid cash runway exceeding three years and no debt, providing financial stability. Its revenue guidance for 2026 was raised to between US$78 million and US$81 million due to strong performance in the first half of the year. While volatility has decreased significantly over the past year, challenges remain as losses continue despite modest revenue growth of 2.5% annually over five years.
- Take a closer look at Valens Semiconductor's potential here in our financial health report.
- Assess Valens Semiconductor's future earnings estimates with our detailed growth reports.
Where To Now?
- Get an in-depth perspective on all 333 US Penny Stocks by using our screener here.
- Contemplating Other Strategies? Trump's oil boom is here — pipelines are primed to profit. Discover the 22 US stocks riding the wave.
This article by Simply Wall St is general in nature. We provide commentary based on historical data and analyst forecasts only using an unbiased methodology and our articles are not intended to be financial advice. It does not constitute a recommendation to buy or sell any stock, and does not take account of your objectives, or your financial situation. We aim to bring you long-term focused analysis driven by fundamental data. Note that our analysis may not factor in the latest price-sensitive company announcements or qualitative material. Simply Wall St has no position in any stocks mentioned.
Have feedback on this article? Concerned about the content? Get in touch with us directly. Alternatively, email editorial-team@simplywallst.com