


EN
Is Safety Insurance Group (SAFT) Fully Priced After Its Strong 2026 Run?
What Just Happened With Safety Insurance Group Stock?
Safety Insurance Group (SAFT) has drawn fresh attention after its recent share price performance, with the stock last closing at US$104.26 and a market value of about US$1.53b.
Investors are weighing that valuation against reported revenue of US$1,286.31m and net income of US$69.20m, as well as returns over the past month, past 3 months, and year to date.
Recent moves in Safety Insurance Group have been steady rather than dramatic, yet the year-to-date share price return of 37.71% and 1-year total shareholder return of 58.41% point to momentum that has been building rather than fading.
Scan beyond Safety Insurance Group and compare its recent momentum with a curated set of insurers and financial stocks screened as 30 resilient stocks with low risk scores.
That kind of run in Safety Insurance Group can tempt you to chase the move or sit on your hands and hope for a pullback. So what does the current valuation actually say about timing an entry now versus waiting?
Price-to-Earnings of 22.1x: Is It Justified for Safety Insurance Group?
On a simple earnings yardstick, Safety Insurance Group looks richly priced. The stock trades on a P/E of 22.1x against a last close of $104.26, while both the US Insurance industry on 11.4x and its peer group on 20.6x sit lower. This points to investors paying a clear premium for each dollar of current profit.
The P/E ratio compares what you pay per share to the earnings that share currently generates. For an insurer like Safety Insurance Group, this is a common way for the market to weigh the quality, stability, and perceived resilience of its underwriting and investment results, especially when full forward forecasts are limited.
With earnings having declined by 12.1% per year over the past 5 years and a fall of 18.7% over the last year, that premium multiple suggests the market is not reacting to recent profit trends alone. Instead, the pricing looks more like a vote of confidence in the business model, its dividend yield of 3.53%, and a perception that current profitability levels may not tell the whole story.
Compared with the broader US Insurance industry on 11.4x, the 22.1x P/E implies Safety Insurance Group is valued at roughly double the sector level. Even against its closer peer set on 20.6x, the stock still trades at a higher earnings multiple, which strengthens the view that investors are accepting a steeper entry price than both the industry and comparable insurers.
See what the numbers say about this price — find out in our valuation breakdown.
Result: Price-to-earnings of 22.1x (OVERVALUED)
Still, a rich 22.1x P/E can come under pressure if profitability weakens further or if insurers with lower valuations in the sector start to look more attractive.
Find out about the key risks to this Safety Insurance Group narrative.
Another View: What The DCF Model Says About Safety Insurance Group
A second lens tells a different story. Our DCF model puts Safety Insurance Group's future cash flow value at about $70.52 per share, well below the current $104.26 price, which points to the stock looking overvalued on this framework.
The gap between price and that DCF estimate suggests limited margin for error if cash flows do not track optimistic expectations. It raises a simple question for you as an investor: Which signal carries more weight, the rich 22.1x P/E or the discounted cash flow gap?
Look into how the SWS DCF model arrives at its fair value.
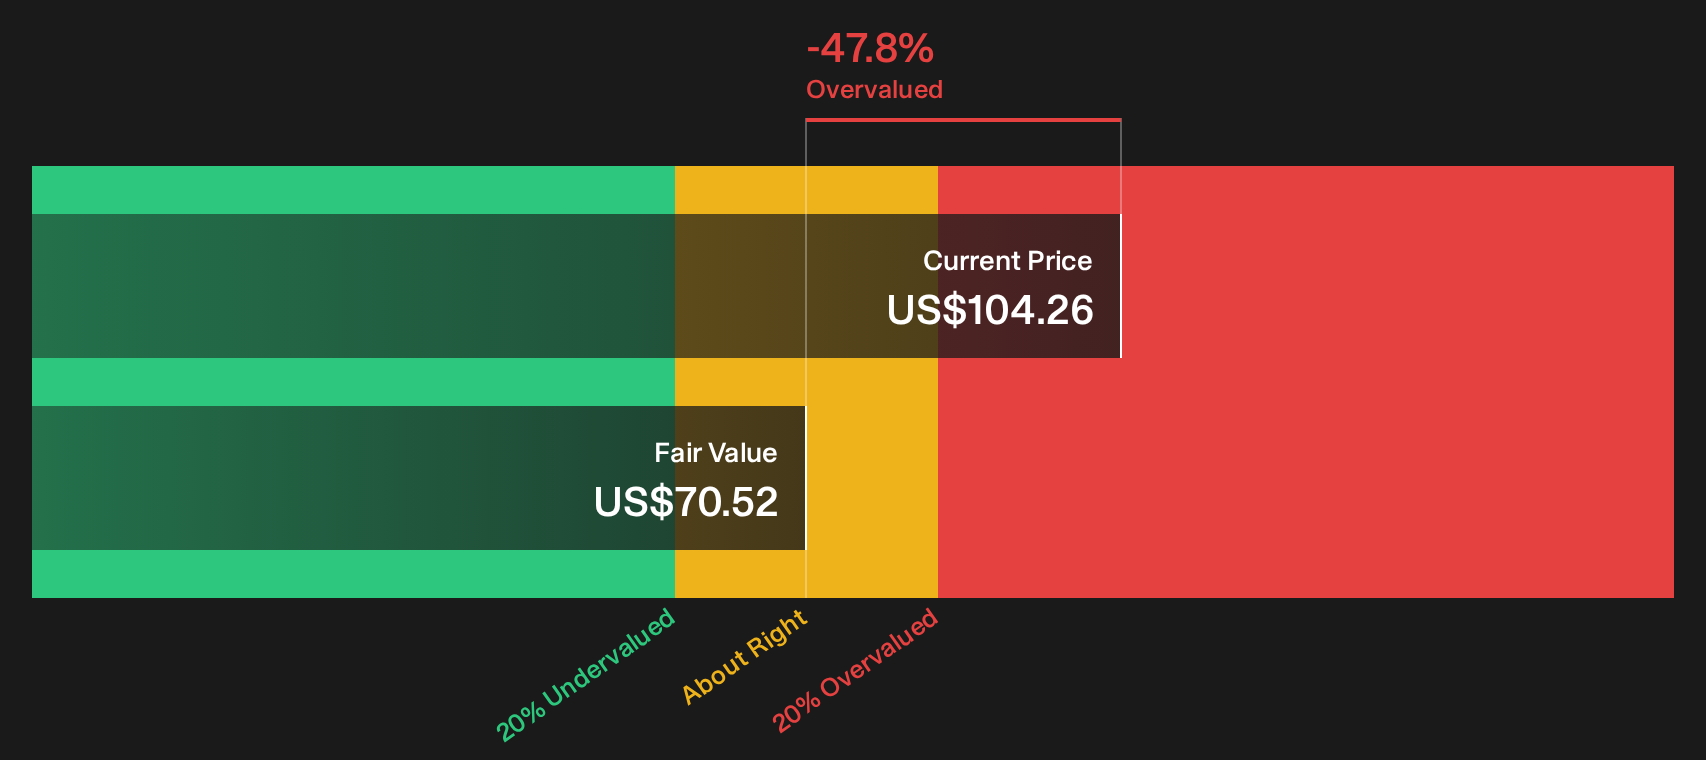
Simply Wall St performs a discounted cash flow (DCF) on every stock in the world every day (check out Safety Insurance Group for example). We show the entire calculation in full. You can track the result in your watchlist or portfolio and be alerted when this changes, or use our stock screener to discover 29 high quality undervalued stocks. If you save a screener we even alert you when new companies match - so you never miss a potential opportunity.
Next Steps
Mixed signals on Safety Insurance Group's valuation and cash flow story can pull you in both directions. Move quickly to test the numbers yourself, review the trade off between potential upside and flagged issues, and ground your decision in the 1 key reward and 1 important warning sign.
Looking for more investment ideas beyond Safety Insurance Group?
Do not stop with one ticker. The best opportunities often sit just outside your current watchlist, and ignoring them can mean missing the setups that really move your portfolio.
- Target resilient balance sheets and cash flows by scanning a curated list of solid balance sheet and fundamentals (24 results) tailored to financially sturdy businesses.
- Hunt for mispriced quality by working through a focused 29 high quality undervalued stocks that highlights companies where fundamentals and current pricing may be out of sync.
- Zero in on dependable income ideas using a dedicated 5 dividend fortresses built to surface higher yielding stocks with staying power.
Have feedback on this article? Concerned about the content? Get in touch with us directly. Alternatively, email editorial-team@simplywallst.com