


EN
Hayward (NYSE:HAYW) delivers strong Q3 2026 numbers, stock soars

Pool equipment and automation systems manufacturer Hayward Holdings (NYSE:HAYW) beat Wall Street’s revenue expectations in Q3 2026, with revenue up 6.5% year on year to $260.1 million. Its non-GAAP profit of $0.18 per share was 18.8% above analysts’ consensus estimates.
For more on Hayward, read our free full research report.
Hayward (HAYW) Q3 2026 highlights:
- Revenue $260.1 million vs S&P analysts’ consensus estimates of $252 million (6.5% year-on-year growth, 3.2% beat)
- Adjusted EPS $0.18 vs S&P analysts’ consensus estimates of $0.15 (18.8% beat)
- Adjusted EBITDA $64.52 million vs analysts’ consensus estimates of $58.42 million (24.8% margin, 10.4% beat)
- Adjusted EPS guidance Management raised its full-year adjusted EPS guidance to $0.87 at the midpoint, a 1.8% increase
- Operating margin 19.3%, up from 16.8% in the same quarter last year
- Free cash flow margin 16.3%, down from 35.7% in the same quarter last year
- Market capitalization $2.76 billion
“Hayward delivered another solid quarter, reflecting disciplined execution and the resilience of our installed base aftermarket business model,” said Kevin Holleran, Hayward’s President and Chief Executive Officer. “Net sales increased 6% year-over-year in the quarter and 8% year-to-date, driven by favorable price realization and higher volumes. Data from our primary U.S. channel partners indicated strong demand for Hayward products, continued market share gains, and balanced channel inventories. Our early buy program for the 2027 pool season is progressing well, with orders ahead of the prior year in North America. We further expanded margins and delivered double-digit earnings growth despite ongoing inflationary pressures. At the same time, we maintained net leverage at 1.5x, the lowest level since our 2021 initial public offering, while increasing capital returns through share repurchases. Our strong year-to-date performance and confidence in continued execution support our increased full year guidance. We remain focused on advancing our strategic growth initiatives and creating long-term stockholder value.”
Revenue growth
A company’s long-term revenue performance can indicate its overall quality. Even a poor business can perform well for one or two quarters, but a high-quality one grows for years. Hayward struggled to consistently generate demand over the last five years as its revenue dropped at a 2% annual rate, falling short of our standards.
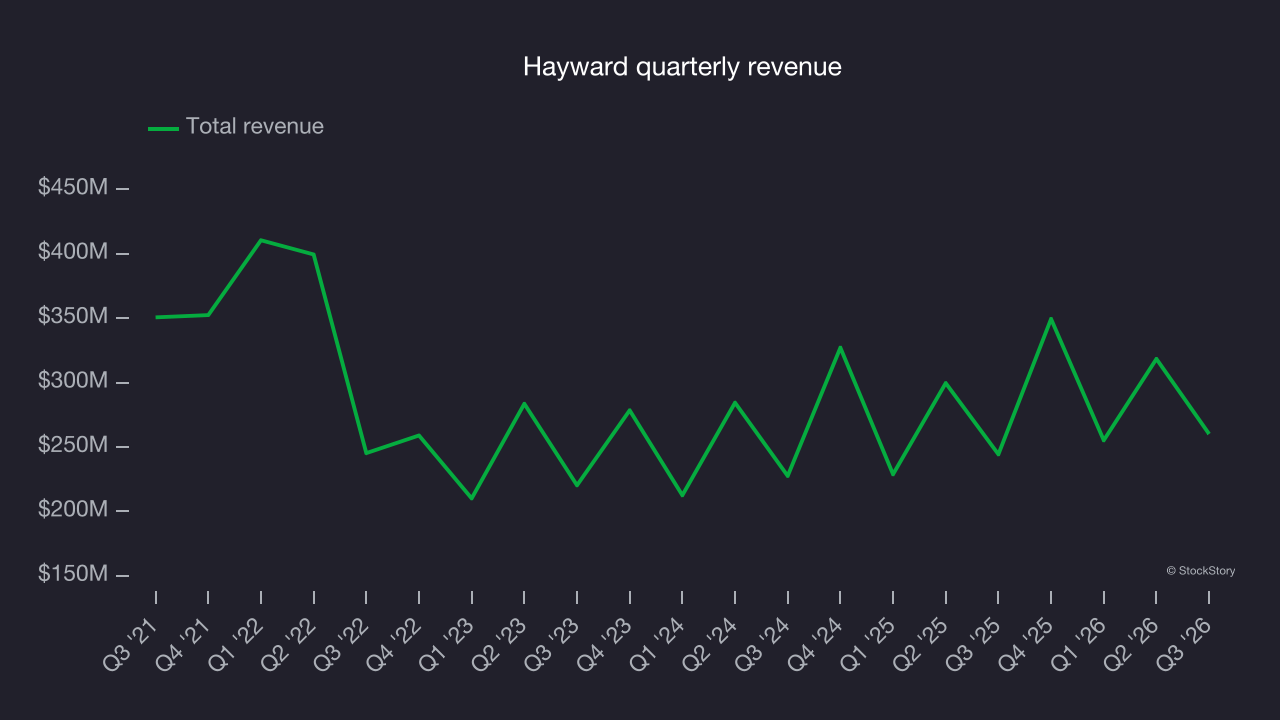
Long-term growth matters most, but within industrials, a half-decade historical view may miss cycles, industry trends or a company capitalizing on catalysts such as a new contract win or a successful product line. Hayward’s annualized revenue growth of 8.6% over the last two years is above its five-year trend, suggesting some bright spots. 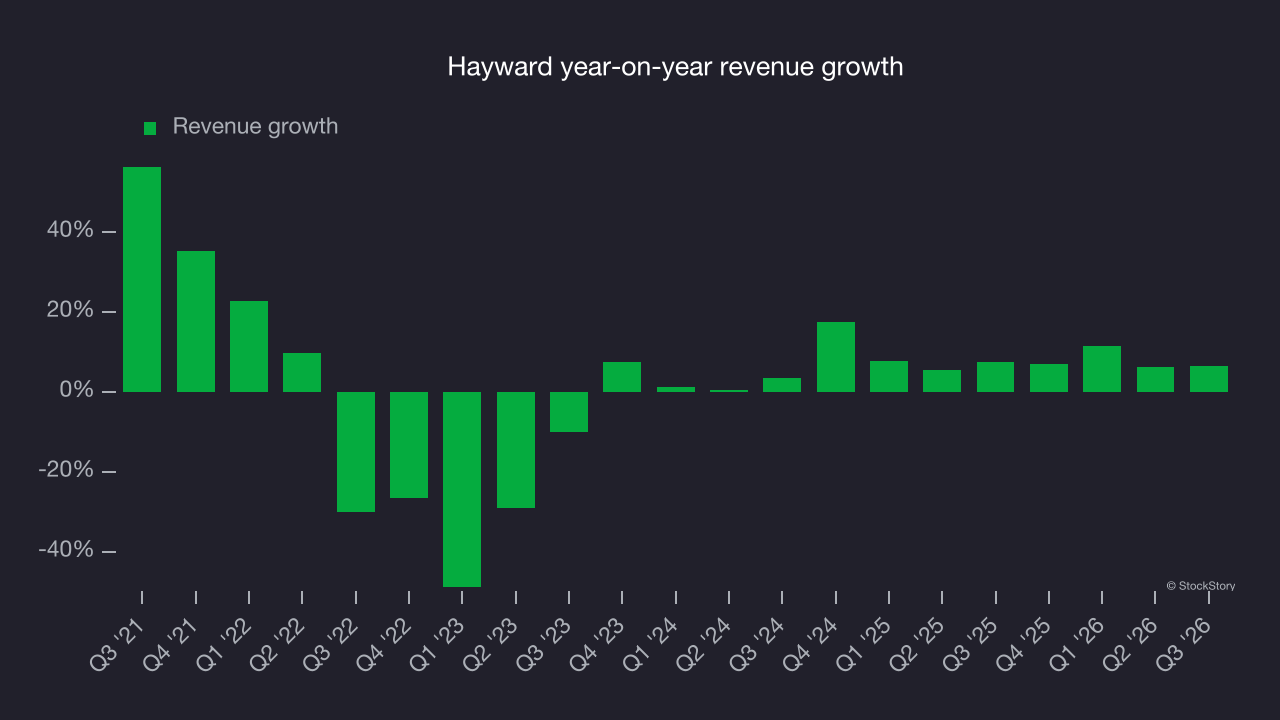
This quarter, Hayward reported year-on-year revenue growth of 6.5%, and its $260.1 million of revenue exceeded Wall Street’s consensus estimates by 3.2%.
Looking ahead, sell-side analysts expect revenue to grow 2.7% over the next 12 months, according to S&P, a deceleration versus the last two years. This underwhelming projection suggests its products and services will face some demand challenges.
Operating margin
Hayward has performed well over the last five years. It demonstrated high profitability for an industrials business, with an average operating margin of 20.3%. This result is unsurprising given its favorable gross margin baseline.
Looking at the trend in its profitability, Hayward’s operating margin decreased by 1.7 percentage points over the last five years. Even though its historical margin was healthy, shareholders will want to see Hayward become more profitable in the future.
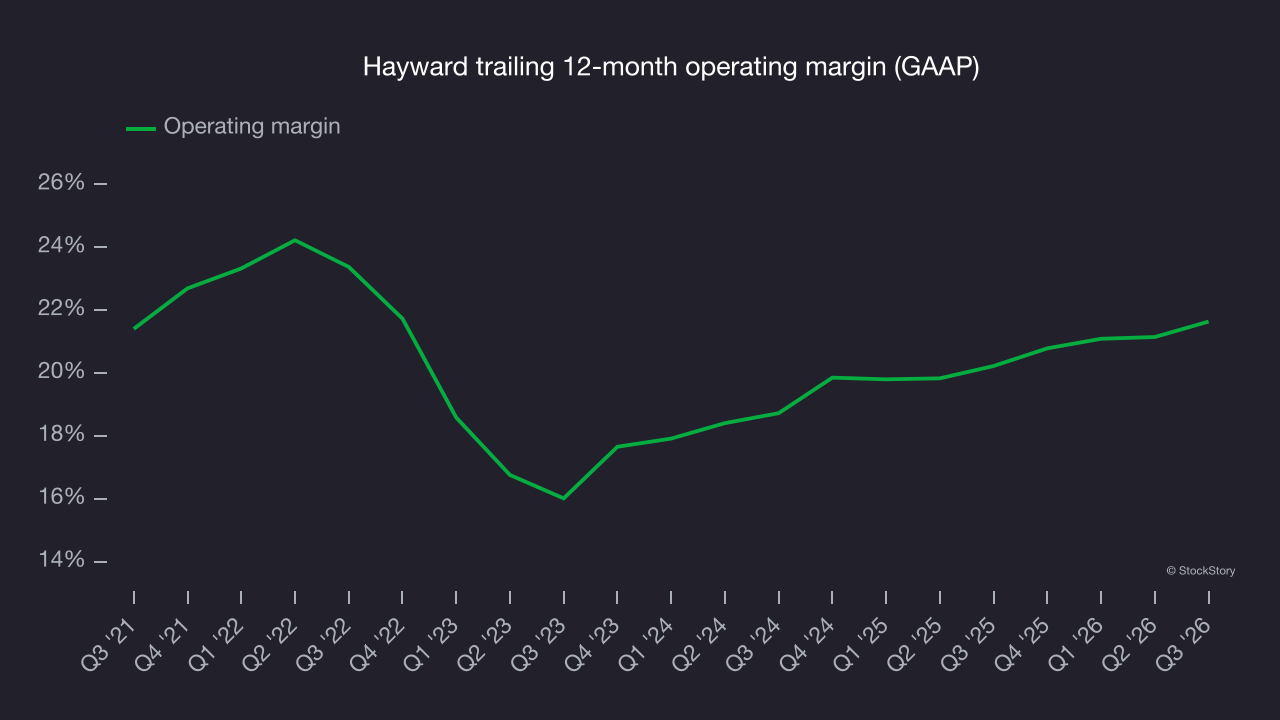
This quarter, Hayward generated an operating margin of 19.3%, up 2.5 percentage points year on year. The increase was a positive sign, and because its gross margin decreased, it suggests improved efficiency as operating expenses such as marketing, R&D and administrative overhead grew more slowly than revenue.
Earnings per share
Revenue trends explain a company’s historical growth, but the long-term change in earnings per share (EPS) points to the profitability of that growth – for example, a company could inflate its revenue through excessive spending on advertising and promotions.
Hayward’s EPS declined by 19.5% annually over the last five years, more than its revenue. This indicates the company struggled because its fixed cost base made it difficult to adjust to shrinking demand.
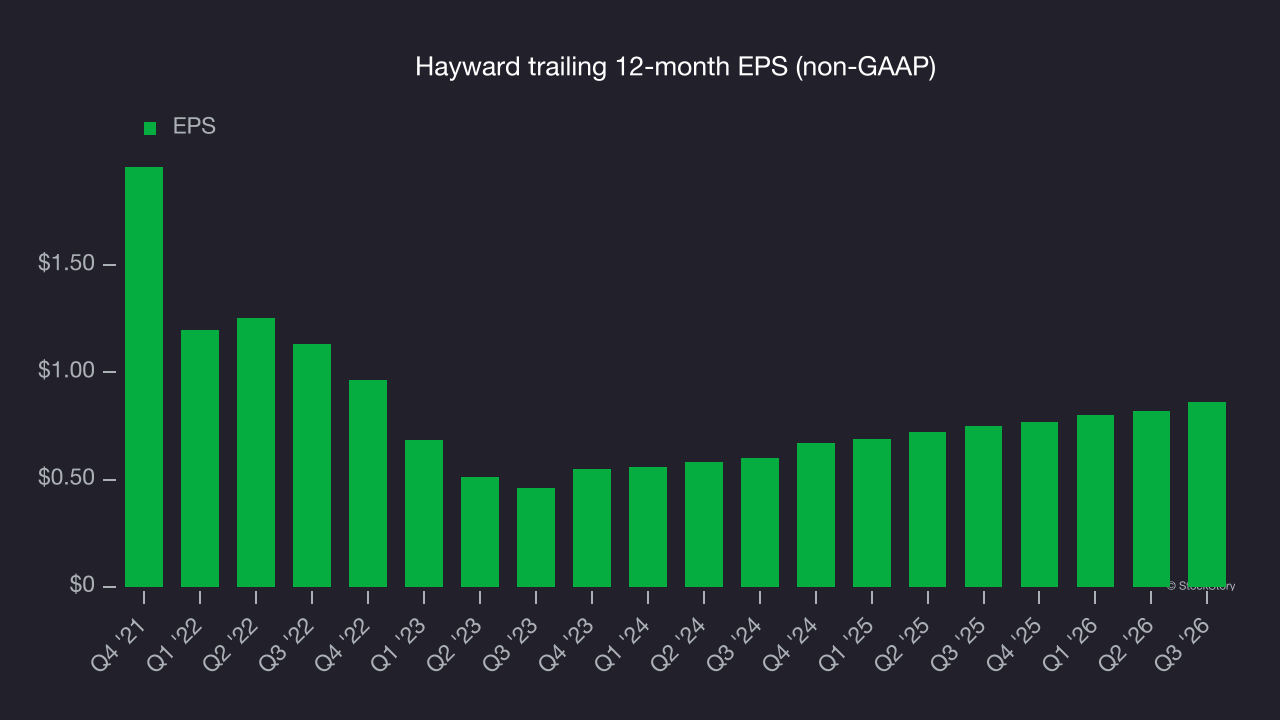
Diving into the nuances of Hayward’s earnings can give us a better understanding of its performance. As we mentioned earlier, Hayward’s operating margin expanded this quarter but declined by 1.7 percentage points over the last five years. This was the most relevant factor (aside from the revenue impact) behind its lower earnings; interest expenses and taxes can also affect EPS but don’t tell us as much about a company’s fundamentals.
Like with revenue, we analyze EPS over a more recent period because it can provide insight into an emerging theme or development for the business.
For Hayward, its two-year annual EPS growth of 19.7% was higher than its five-year trend. This acceleration made it one of the faster-growing industrials companies in recent history.
In Q3, Hayward reported adjusted EPS of $0.18, up from $0.14 in the same quarter last year. EPS comfortably beat analysts’ consensus estimates, a positive result for shareholders. Over the next 12 months, Wall Street expects Hayward’s full-year EPS to grow 7.1% from $0.86 to $0.92, according to S&P.
Key takeaways from Hayward’s Q3 results
Hayward delivered a solid quarter, with EBITDA coming in well above analysts’ consensus estimates and revenue also topping Wall Street’s consensus. Shares surged 5.4% to $13.74 immediately after the results.
Hayward had a solid quarterly earnings result, but is the stock a good investment? The latest quarter is only one piece of the longer-term business quality picture. Quality, when combined with valuation, can help determine if the stock is a buy. For more on Hayward, read our full research report here (it’s free).