


EN
3 Stocks That May Be Trading Below Estimated Value In October 2026
In the last week, the United States market has remained flat, yet it is up 9.2% over the past year with earnings forecast to grow by 17% annually. In this environment, identifying stocks that may be trading below their estimated value can offer potential opportunities for investors seeking to capitalize on future growth prospects.
Top 10 Undervalued Stocks Based On Cash Flows In The United States
| Name | Current Price | Fair Value (Est) | Discount (Est) |
| Textron (TXT) | $78.18 | $148.75 | 47.4% |
| Signet Jewelers (SIG) | $115.22 | $217.60 | 47% |
| Northeast Bank (NBN) | $132.98 | $246.26 | 46% |
| Noah Holdings (NOAH) | $6.87 | $13.30 | 48.4% |
| Halliburton (HAL) | $35.62 | $66.22 | 46.2% |
| ConnectOne Bancorp (CNOB) | $32.99 | $67.66 | 51.2% |
| Comfort Systems USA (FIX) | $1288.61 | $2385.57 | 46% |
| Atlantic Union Bankshares (AUB) | $39.42 | $78.92 | 50.1% |
| Artisan Partners Asset Management (APAM) | $33.20 | $64.86 | 48.8% |
| Amazon.com (AMZN) | $253.10 | $472.18 | 46.4% |
Underneath we present a selection of stocks filtered out by our screen.
American Superconductor (AMSC)
Overview: American Superconductor Corporation, along with its subsidiaries, offers megawatt-scale power resiliency solutions globally and has a market cap of approximately $1.23 billion.
Operations: The company generates revenue from two primary segments: Grid, contributing $267.55 million, and Wind, accounting for $53.32 million.
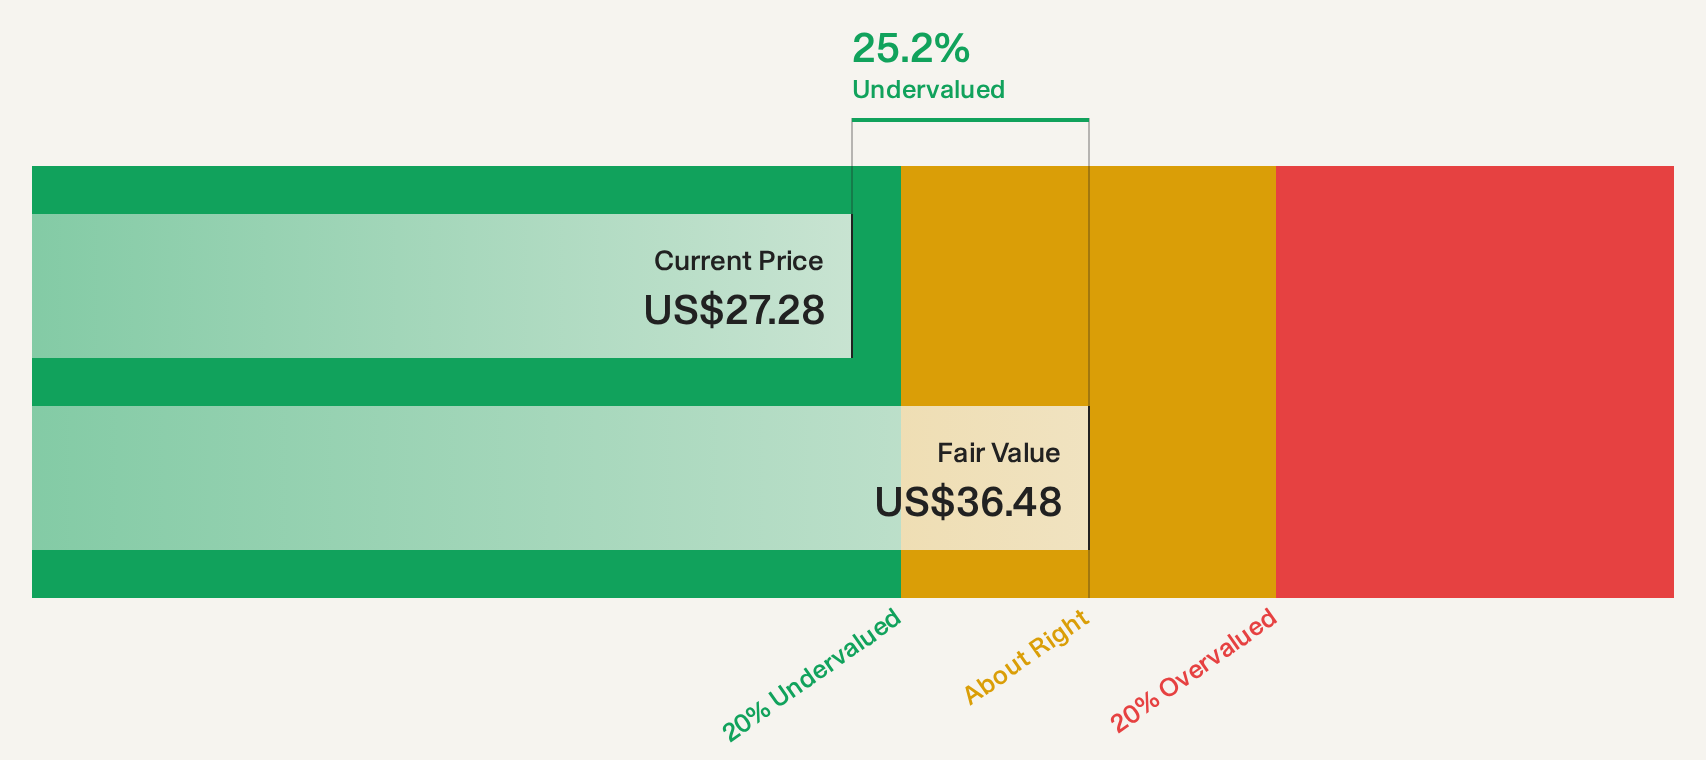
Estimated Discount To Fair Value: 27.6%
American Superconductor appears undervalued, trading 27.6% below its estimated fair value and 20% under its future cash flow value. Despite a significant order from a North American utility, earnings are forecast to decline by an average of 74.2% per year over the next three years, although revenue is expected to grow at 17.4% annually, outpacing the broader US market's growth rate of 13.4%.
- Upon reviewing our latest growth report, American Superconductor's projected financial performance appears quite optimistic.
- Click to explore a detailed breakdown of our findings in American Superconductor's balance sheet health report.
NVIDIA (NVDA)
Overview: NVIDIA Corporation operates as a data center scale AI infrastructure company across the United States, Taiwan, China, Hong Kong, Europe, and internationally with a market capitalization of $5215.75 billion.
Operations: The company's revenue is derived from two main segments: Graphics, contributing $27.56 billion, and Compute & Networking, generating $275.41 billion.
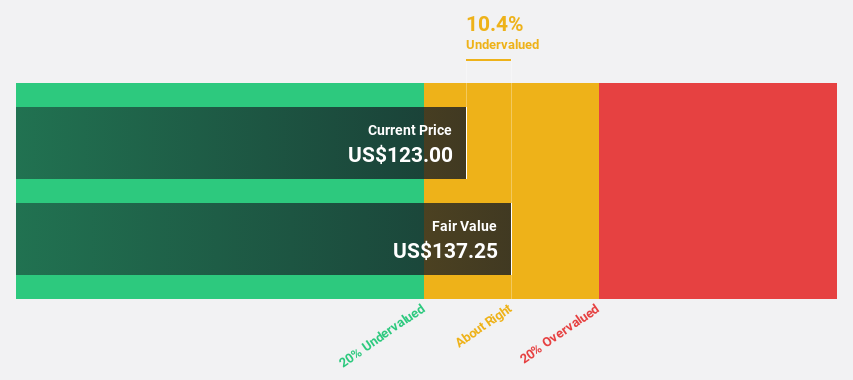
Estimated Discount To Fair Value: 31.1%
NVIDIA, trading at US$217.94, is considered undervalued with a fair value estimate of US$316.14 based on discounted cash flow analysis. The company's earnings and revenue are projected to grow significantly faster than the US market over the next three years. However, recent insider selling could be a concern for some investors. NVIDIA's strategic partnerships and expansions in AI infrastructure further bolster its growth prospects, enhancing its position in the technology sector.
- Our earnings growth report unveils the potential for significant increases in NVIDIA's future results.
- Click here and access our complete balance sheet health report to understand the dynamics of NVIDIA.
Flowserve (FLS)
Overview: Flowserve Corporation designs, manufactures, distributes, and services industrial flow management equipment across various regions including the United States, Canada, Mexico, Europe, the Middle East, Africa, and the Asia Pacific with a market cap of approximately $8.84 billion.
Operations: Flowserve's revenue is primarily generated from its Flow Control Division, contributing $1.45 billion, and its Flowserve Pump Division, which accounts for $3.19 billion.
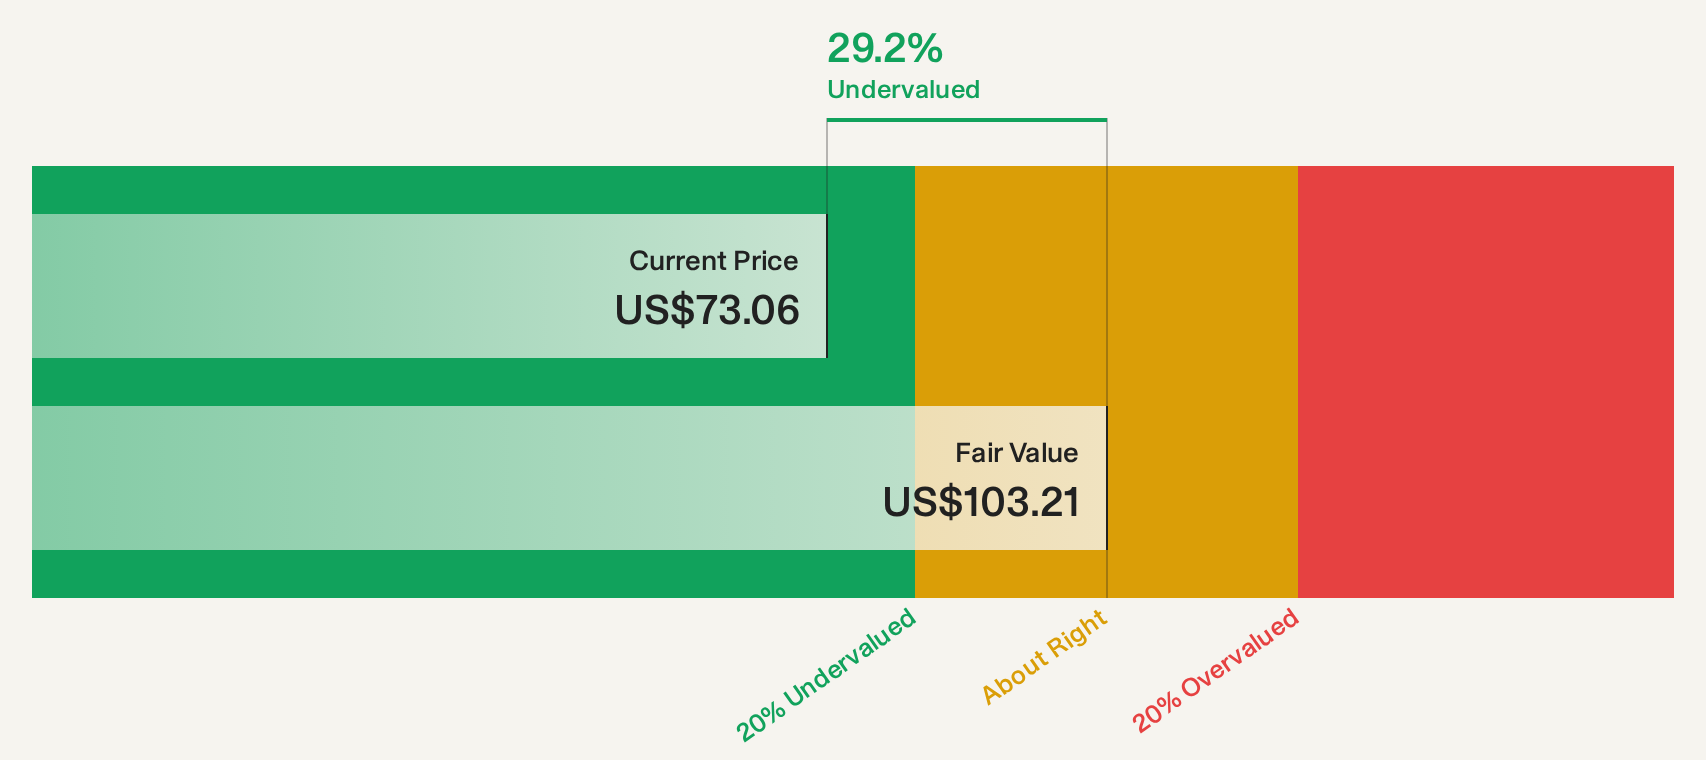
Estimated Discount To Fair Value: 32.4%
Flowserve, priced at US$70.84, trades below its estimated future cash flow value of US$104.79, highlighting potential undervaluation. Its earnings are forecast to grow significantly at 22.1% annually over the next three years, outpacing the broader US market's growth rate. Despite high debt levels and slower revenue growth compared to the market, Flowserve's strategic financial leadership changes and consistent dividend payments may offer stability for investors seeking value based on cash flows.
- According our earnings growth report, there's an indication that Flowserve might be ready to expand.
- Get an in-depth perspective on Flowserve's balance sheet by reading our health report here.
Next Steps
- Investigate our full lineup of 90 Undervalued US Stocks Based On Cash Flows right here.
- Are any of these part of your asset mix? Tap into the analytical power of Simply Wall St's portfolio to get a 360-degree view on how they're shaping up.
- Enhance your investing ability with the Simply Wall St app and enjoy free access to essential market intelligence spanning every continent.
Curious About Other Options?
- Explore high-performing small cap companies that haven't yet garnered significant analyst attention.
- Diversify your portfolio with solid dividend payers offering reliable income streams to weather potential market turbulence.
- Fuel your portfolio with companies showing strong growth potential, backed by optimistic outlooks both from analysts and management.
This article by Simply Wall St is general in nature. We provide commentary based on historical data and analyst forecasts only using an unbiased methodology and our articles are not intended to be financial advice. It does not constitute a recommendation to buy or sell any stock, and does not take account of your objectives, or your financial situation. We aim to bring you long-term focused analysis driven by fundamental data. Note that our analysis may not factor in the latest price-sensitive company announcements or qualitative material. Simply Wall St has no position in any stocks mentioned.
Have feedback on this article? Concerned about the content? Get in touch with us directly. Alternatively, email editorial-team@simplywallst.com