


EN
Sterling Infrastructure (STRL), What Is Drawing Investors In Today?
Sterling Infrastructure (STRL) heads into its Q3 2026 earnings release this afternoon with expectations shaped by a sharp share pullback, a heavy E-Infrastructure backlog, and a recent run of estimate beats.
Recent trading has been volatile. The share price is down 28.3% over the past month and 25.6% over the last 90 days, yet Sterling Infrastructure still carries a 3-year total shareholder return above 4x and a very large 5-year total shareholder return, which signals longer term momentum even as sentiment cools ahead of earnings.
Scan beyond Sterling Infrastructure and compare this setup with other construction and infrastructure plays using our curated list of 42 power grid technology and infrastructure stocks.
After a 28% slide in a month, with analysts clustered far above the current US$367.50 quote and fair value models pointing to an even wider gap, where does Sterling Infrastructure’s true worth actually line up on that spectrum?
Most Popular Narrative: 56% Undervalued
Sterling Infrastructure’s most followed narrative pegs fair value at about $836.57 a share, well above the last close at $367.50. This puts the current pullback against a story built on long dated E-Infrastructure work and hefty earnings expectations.
Sterling Infrastructure’s multi year pool of signed backlog and high probability future phase work now exceeds US$7b, heavily weighted to mission critical data center and semiconductor projects. This could continue to support revenue growth and earnings visibility if awards convert into execution as planned.
See why 104 investors see Sterling Infrastructure as 56% undervalued.
Result: Fair Value of $836.57 (UNDERVALUED)
Still, this fair value story weakens quickly if Sterling Infrastructure encounters issues with labor capacity for long-dated electrical work or if timing quirks reduce that US$7b backlog.
Find out about the key risks to this Sterling Infrastructure narrative.
Another View: What The P/E Says About Sterling Infrastructure
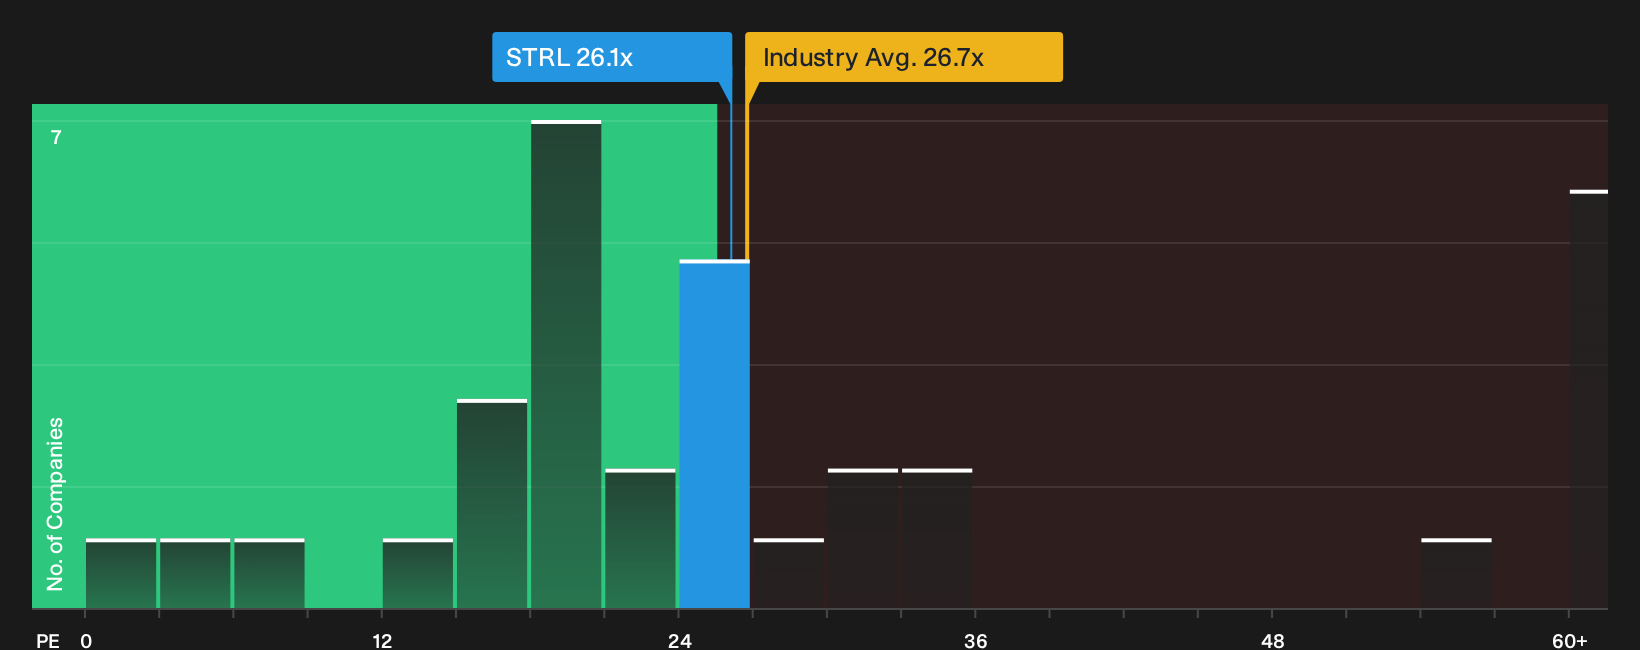
The story shifts when you swap fair value models for a plain P/E lens. Sterling Infrastructure trades on 26.1x earnings, which is slightly below the US Construction industry at 26.7x but above its direct peer group near 21.3x.
Our fair ratio for Sterling Infrastructure is 58.6x earnings. That is more than double the current P/E, which suggests the market could move a long way before lining up with that model. For anyone weighing upside against the risk of multiple compression back toward peers, the key question is which reference point feels more realistic for the next phase of this stock.
See what the numbers say about this price — find out in our valuation breakdown.
Next Steps
Mixed on Sterling Infrastructure after all that. For a move this sharp, it helps to check the full picture quickly and weigh both the upside drivers and the pressure points. Then decide where you stand with the 4 key rewards and 1 important warning sign.
Looking for more investment ideas beyond Sterling Infrastructure?
If Sterling Infrastructure has sharpened your focus, use this moment to line up your next candidates with a few targeted screeners before the market moves.
- Spot potential mispricings early and sort through a 29 high quality undervalued stocks that filters for quality businesses trading below their estimated worth.
- Prioritise resilience first and scan a 30 resilient stocks with low risk scores that filters for companies with stronger balance sheets and more stable risk profiles.
- Get ahead of the crowd and comb through a 21 high quality undiscovered gems that highlights underfollowed stocks with solid fundamentals and room for attention to build.
Have feedback on this article? Concerned about the content? Get in touch with us directly. Alternatively, email editorial-team@simplywallst.com