


EN
Why Berkshire Hathaway (BRK.B) Is Getting Attention Today
Recent share performance and scale
Berkshire Hathaway (BRK.B) has moved quietly but firmly onto investor screens after the stock retreated about 1% over the past day while still showing gains over the past week and month.
Across the past week the share price edged up roughly 0.6%, with the month showing an advance of about 7.4% and the past 3 months rising around 6.6%. Over the past year, the total return sits near 12.8%, with year to date performance close to 9.3% and a 3 year total return of about 5.9x.
The recent close near US$542.99 places the market value of Berkshire Hathaway at roughly US$1.17t, which puts the group among the largest publicly traded financial holding companies globally.
Berkshire Hathaway’s share price has eased over the last day but still carries positive short term momentum, while the 1-year total shareholder return points to a stronger longer run contribution once dividends are factored in.
The mix of a recent pullback from US$542.99 and a positive 30-day share price return of about 7.4% hints at investors recalibrating expectations rather than abandoning the story. The 3-year total shareholder return of roughly 59.1% continues to frame Berkshire Hathaway as a long haul compounder in many portfolios.
Contrast Berkshire Hathaway’s long haul record with a curated set of other potential compounders by scanning our 29 high quality undervalued stocks that share solid cash generation and balance sheet strength.
After a sharp climb over the past month and only a mild step back in the last day, Berkshire Hathaway now forces a simple choice: pay up today or hold out for a cheaper shot.
Preferred P/E of 13.5x: Is it justified?
Berkshire Hathaway changes hands at a P/E of 13.5x, and that multiple sits below both peers and the broader US diversified financials group. The latest closing price is $542.99.
The P/E ratio compares the share price to earnings per share and acts as a quick way to see how much investors are paying for each dollar of profit. For a conglomerate like Berkshire Hathaway, which spans insurance, rail, utilities, manufacturing, retail and more, earnings power is a central anchor for how the market prices the stock.
The current 13.5x P/E is below the estimated fair P/E of 14.8x. This suggests the market is assigning a lower tag than the earnings profile might justify based on that model. It also sits at a discount to the US diversified financials industry average P/E of 17.2x and the peer group on 23.4x. This points to a market that is pricing Berkshire Hathaway more conservatively than both its sector and closest comparables and indicates potential for that gap to close if sentiment or results eventually line up with the fair ratio.
Explore the SWS fair ratio for Berkshire Hathaway.
Result: Price-to-earnings of 13.5x (UNDERVALUED)
Still, Berkshire Hathaway faces real pressure points if annual net income continues to decline or if key segments such as insurance or rail deliver weaker earnings power.
Find out about the key risks to this Berkshire Hathaway narrative.
Another view on Berkshire Hathaway’s value
The P/E work presents Berkshire Hathaway as underpriced. A different lens tells a similar story. Simply Wall St’s DCF model values the shares at about $799.70 per share versus the current $542.99 level, which indicates the stock trades at a material discount based on projected cash flows.
That gap can indicate a potential opportunity for long-term buyers or a warning that cash flow assumptions may prove too optimistic. The key question is which side of that trade an investor believes is more likely to hold up over time.
Look into how the SWS DCF model arrives at its fair value.
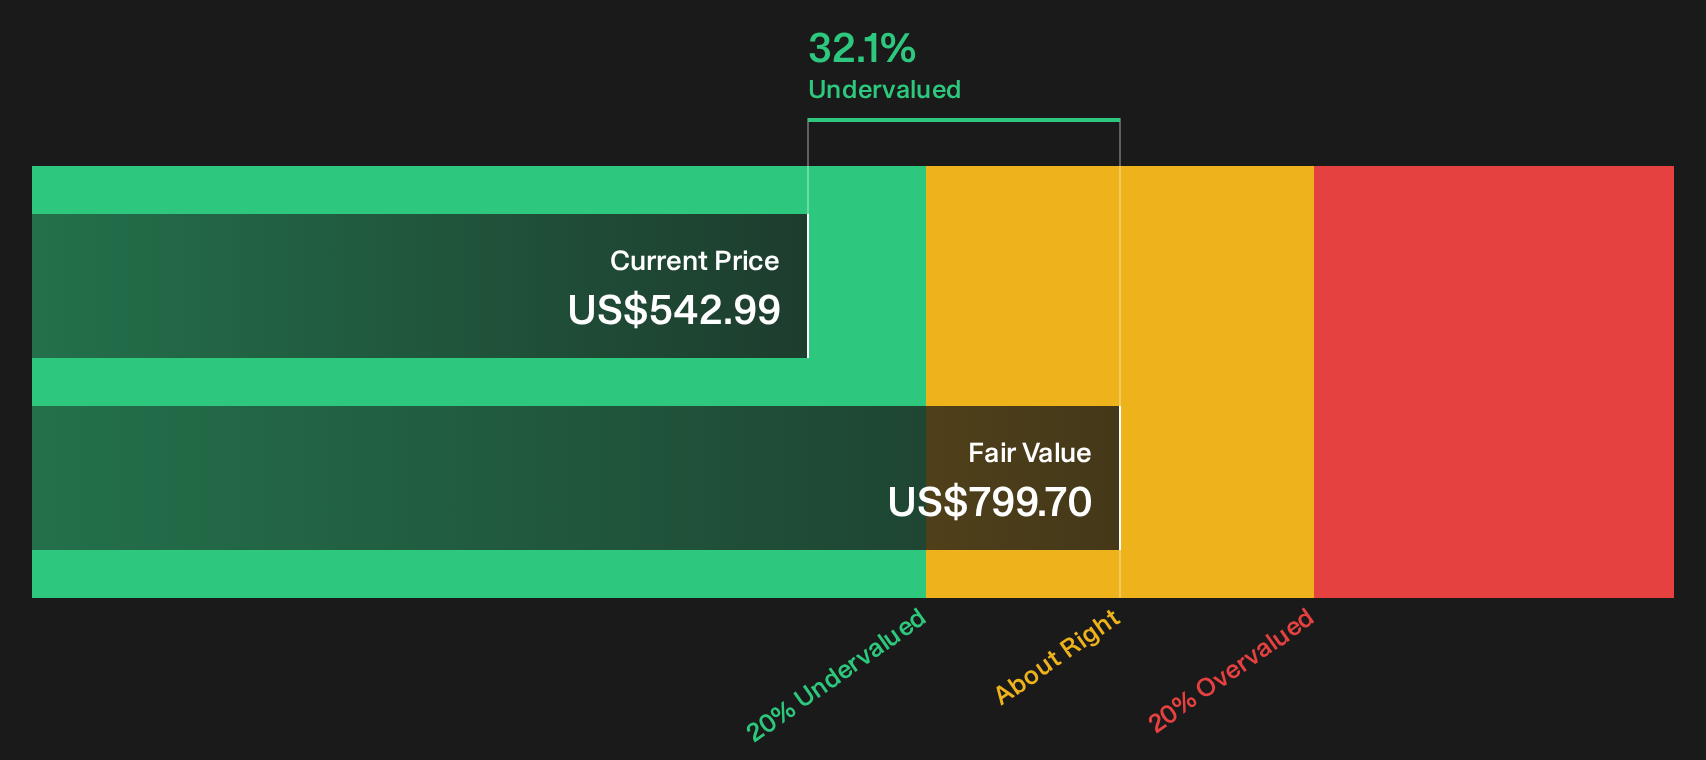
Simply Wall St performs a discounted cash flow (DCF) on every stock in the world every day (check out Berkshire Hathaway for example). We show the entire calculation in full. You can track the result in your watchlist or portfolio and be alerted when this changes, or use our stock screener to discover 29 high quality undervalued stocks. If you save a screener we even alert you when new companies match - so you never miss a potential opportunity.
Next Steps
If you are undecided about Berkshire Hathaway because of the combination of potential upside and existing concerns, take time to review the underlying data and form your own view. To see both perspectives together in one place, review the 3 key rewards and 1 important warning sign
Looking for more Berkshire Hathaway style investment ideas?
You do not need to stop with Berkshire Hathaway. Use the Simply Wall St screener to spot other opportunities that match your risk, return, and income goals.
- Target potential mispricing early by scanning a curated 29 high quality undervalued stocks that lines up solid fundamentals with attractive entry points.
- Focus on the income angle by reviewing a focused 5 dividend fortresses built around higher yields and robust cash generation.
- Prioritise downside protection by filtering for a 30 resilient stocks with low risk scores that emphasises resilient balance sheets and steadier risk profiles.
Have feedback on this article? Concerned about the content? Get in touch with us directly. Alternatively, email editorial-team@simplywallst.com