


EN
Is Asana (ASAN) Undervalued After Resistance At $12 And Heavy Options Activity?
Asana (ASAN) is back in focus after its share price met resistance near US$12 following a 10 month high, with options activity flashing an unusually elevated 10 day put or call volume ratio.
Recent trading paints a mixed picture for Asana. The 30 day share price return of 31.49% and 90 day gain of 39.37% point to short term momentum. In contrast, the year to date share price decline of 8.49% and 1 year total shareholder return fall of 16.83% show a longer track record that is still catching up to the recent shift in sentiment.
Scan for other software stocks showing similar technical set ups and options interest by heading to our hand picked 39 profitable AI stocks that aren't just burning cash alongside Asana.
Asana’s recent surge and options buzz could be signaling a real shift in the underlying business, or just a sentiment swing after a tough year. The valuation numbers draw a sharper line between those two stories next.
Most Popular Narrative: 18% Overvalued
Asana last closed at $11.86, while the most followed narrative pegs fair value near $10.08 using a discount rate of 8.96%. That gap sets the stage for a story built around AI products, recurring revenue and how much investors are prepared to pay for them.
Asana's integration of AI into structured workflow automation (AI Studio, smart workflows, and upcoming AI Teammates) is unlocking new, highly valued enterprise use cases that increase platform stickiness, boost customer expansion and drive higher ARPU, supporting accelerated mid
to long-term revenue growth.
See why 14 investors see Asana as 18% overvalued.
Result: Fair Value of $10.08 (OVERVALUED)
Still, the Asana story can change quickly if large enterprise renewals soften or if bigger platforms use bundled AI tools to pull customers and pricing away.
Find out about the key risks to this Asana narrative.
Another View: Asana Through A Cash Flow Lens
The story changes when you look at Asana through the SWS DCF model instead of the analyst narrative. On that math, the stock trades around $11.86 while the estimated future cash flow value sits near $22.57, which indicates Asana may be changing hands at roughly a 47.5% discount. If analysts currently view it as 18% overvalued and the cash flow work suggests it is inexpensive, which framework aligns better with your own process?
Look into how the SWS DCF model arrives at its fair value.
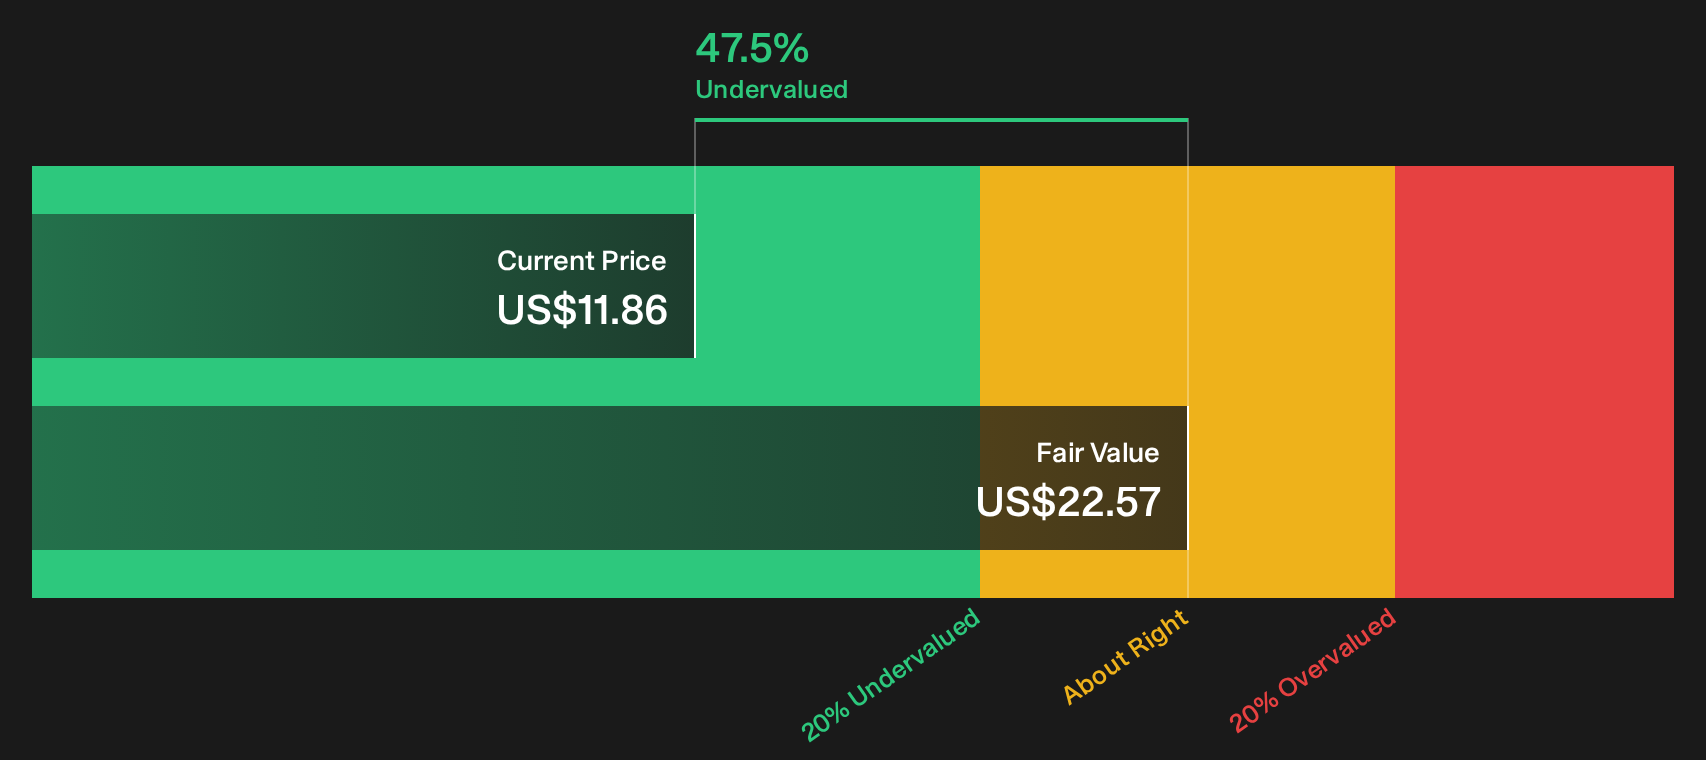
Simply Wall St performs a discounted cash flow (DCF) on every stock in the world every day (check out Asana for example). We show the entire calculation in full. You can track the result in your watchlist or portfolio and be alerted when this changes, or use our stock screener to discover 29 high quality undervalued stocks. If you save a screener we even alert you when new companies match - so you never miss a potential opportunity.
Next Steps
If the split between Asana’s fair value estimates leaves you undecided, move quickly to review the underlying data and assumptions yourself. Then weigh up the 2 key rewards and 2 important warning signs.
Looking for more investment ideas beyond Asana?
Do not stop with Asana. Use the wider market to test your thesis across different themes, balance sheets and return profiles while this setup is fresh in your mind.
- Target potential mispricing by scanning companies that combine quality fundamentals with discounted valuations through the 29 high quality undervalued stocks.
- Strengthen your income corner by reviewing dependable payers screened as 5 dividend fortresses that may help anchor total returns.
- Reduce portfolio stress by focusing on resilient businesses highlighted in the 30 resilient stocks with low risk scores that aim to limit downside when conditions turn rough.
Have feedback on this article? Concerned about the content? Get in touch with us directly. Alternatively, email editorial-team@simplywallst.com