


EN
SFL (SFL) Could Be 4% Undervalued As Charter Backlog Supports Fair Value
SFL (NYSE:SFL) has drawn fresh attention after its recent trading performance, with the share price around $12.70. Returns over the past month are slightly down, while the past 3 months show a modest gain.
In the short term, SFL’s 7-day share price return of 5.57% and 90-day gain of 4.70% point to building momentum. The year-to-date share price return of 60.96% and 1-year total shareholder return of 88.50% show a strong recent run, which is on top of a 5-year total shareholder return of 156.74%.
Scan beyond SFL’s recent run and size up other shipping and energy plays that screen well on fundamentals with our curated list of solid balance sheet and fundamentals (24 results) today.
Bulls point to SFL’s strong recent shareholder returns and ongoing charter income, while bears see a hot chart near price targets. Which story lines up better with what the valuation says next?
Most Popular Narrative: 4% Undervalued
SFL last closed at $12.70, slightly below the most followed fair value estimate of $13.17. This supports a modest undervaluation narrative based on contracted cash flows and modern assets.
The company’s expanding long term charter backlog, which reached roughly US$4.6b with about US$750 million added from the Hapag Lloyd container extensions and a large share contracted to investment grade counterparties, supports visibility on future revenue and provides a base for steady earnings and dividend coverage.
See why 15 investors see SFL as 4% undervalued.
Result: Fair Value of $13.17 (UNDERVALUED)
Still, the SFL story can shift quickly if the roughly US$1.2b of remaining growth capex tightens financial flexibility, or if container demand softens against that charter backlog.
Find out about the key risks to this SFL narrative.
Another View: What Multiples Say About SFL
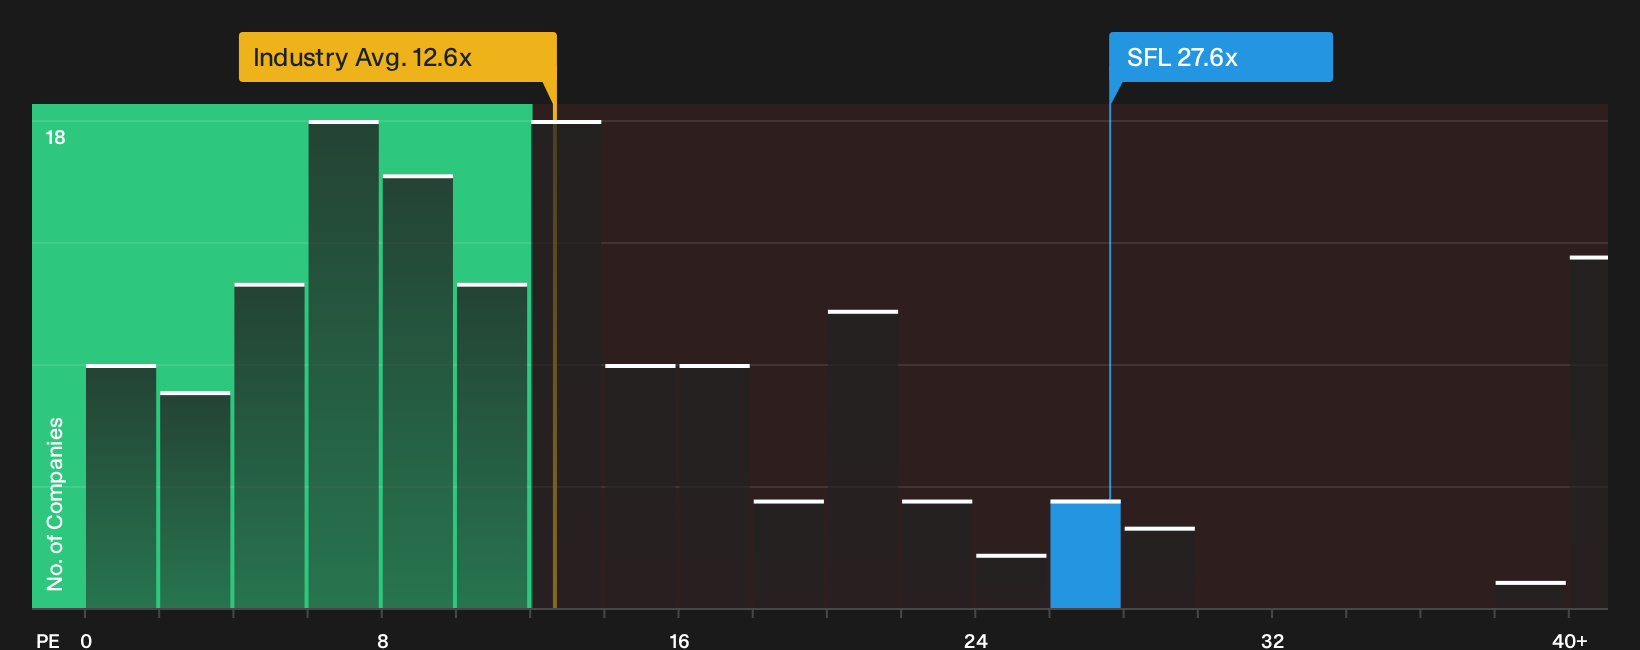
The fair value estimate around $13.17 is based on cash flow and backlog. A different lens looks at what investors are paying per dollar of earnings. SFL trades on a P/E of 27.6x, compared with 10.9x for peers and 12.6x for the wider US Oil and Gas group.
The fair ratio for SFL sits at 23.7x, so the current multiple is meaningfully higher than where the market could eventually settle. That gap points to valuation risk rather than clear upside, especially after a strong 1-year share price run. Which signal do you trust more: the fair value model, or what the earnings multiple is already indicating?
See what the numbers say about this price — find out in our valuation breakdown.
Next Steps
Mixed messages on SFL so far. If you want your view anchored in the actual numbers rather than the headlines, start by weighing the 2 key rewards and 2 important warning signs.
Looking for more SFL-sized investment ideas?
If you stop with SFL, you only see one angle. Broaden your watchlist with data driven ideas that match your risk profile and income goals.
- Target quality potential and filter for companies that combine strong fundamentals with attractive pricing through a focused 29 high quality undervalued stocks.
- Build income resilience and track businesses that offer higher yields with balance sheets designed to support consistent payouts using a curated 5 dividend fortresses.
- Dial down volatility risk and concentrate on businesses with sturdier finances by scanning a 30 resilient stocks with low risk scores tailored to more cautious investors.
Have feedback on this article? Concerned about the content? Get in touch with us directly. Alternatively, email editorial-team@simplywallst.com