


EN
Cincinnati Financial (CINF) Q3 Earnings Confront Catastrophe Driven Profit Fade
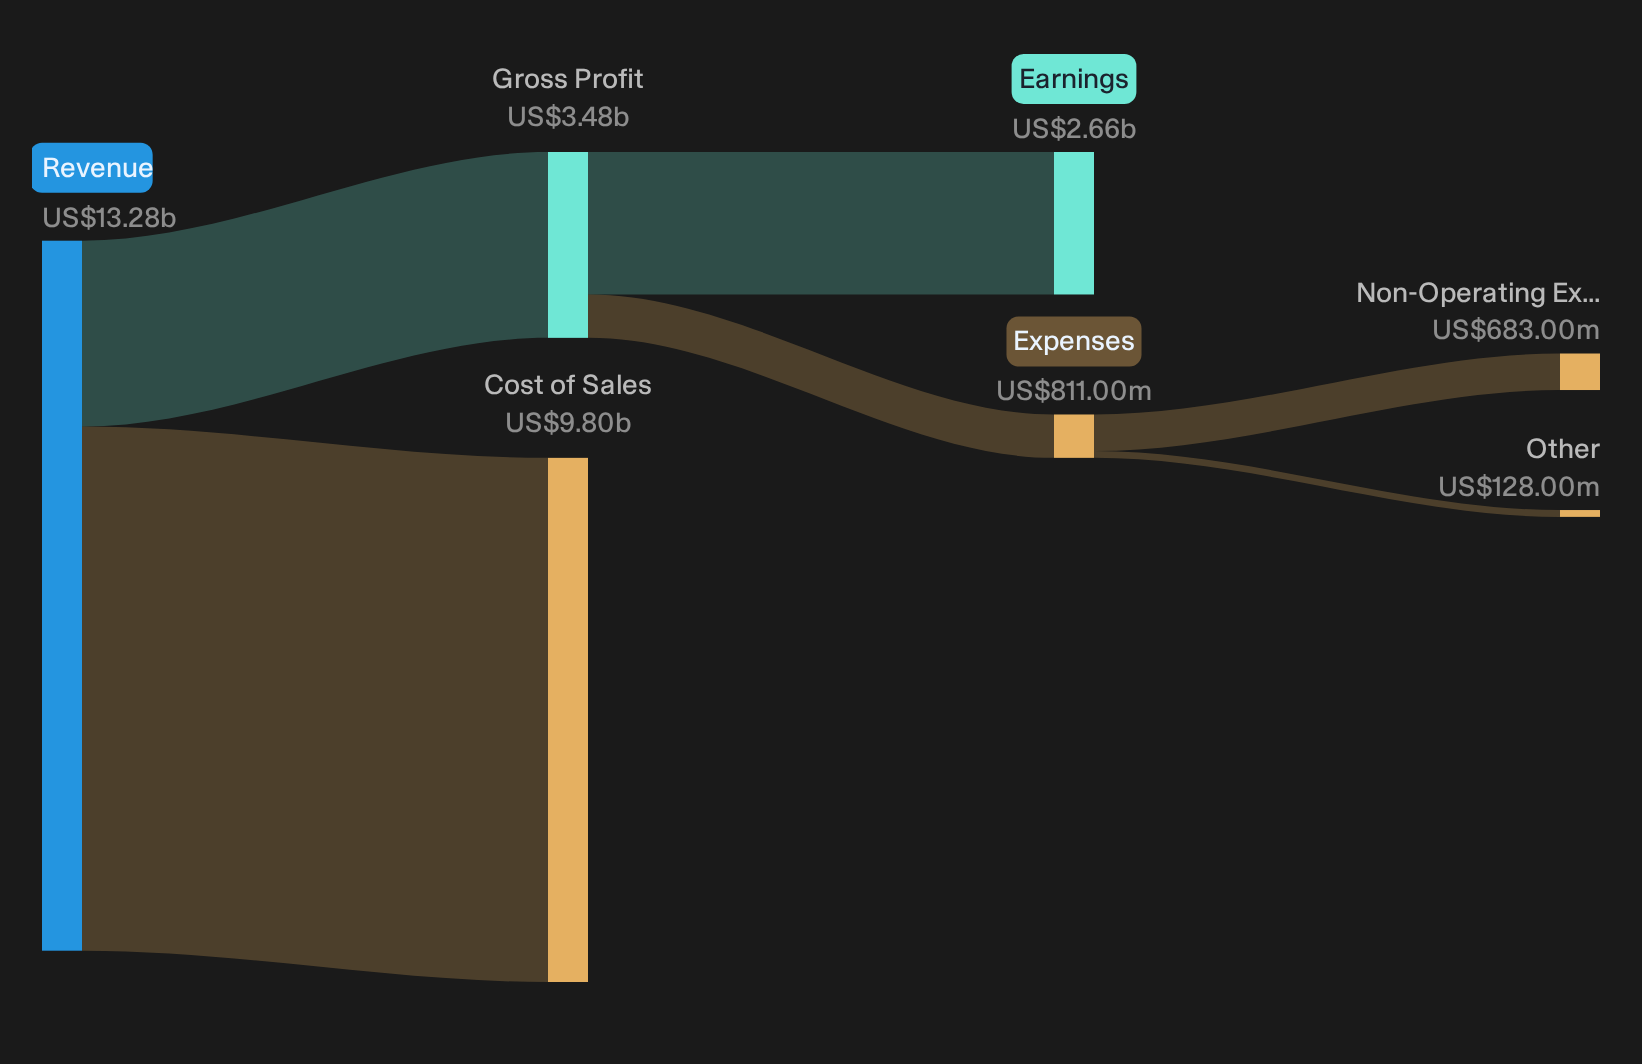
Cincinnati Financial came into this Q3 2026 report with investors already rewarded, the stock up over 11% in the past month and closing at US$181.41, a 2.3% gain on the day. The move suggests relief and renewed confidence. The earnings print itself pointed straight at profitability, with Q3 net income of US$459 million and clear focus on the property and casualty combined ratio as the key quality check. That is where the expectation gap sits right now. A premium valuation story meets an insurer still judged on how efficiently it turns premiums into underwriting profit.
Like the profitability focus at Cincinnati Financial but wary of paying up for an insurer still proving its underwriting efficiency each quarter? Check our screener of property and casualty peers with stronger balance sheet metrics and underwriting discipline through the list of solid balance sheet and fundamentals stocks (24 results).
Q3 2026 Earnings Summary
- Total Revenue (Q3 2026 vs. Q3 2025): US$3,047 million vs. US$3,726 million (down 18.2%)
- Net Income (Excl. Extra Items, Q3 2026 vs. Q3 2025): US$459 million vs. US$1,122 million (down 59.1%)
- Basic EPS (Q3 2026 vs. Q3 2025): US$2.99 vs. US$7.19 (down 58.4%)
- Property and Casualty Combined Ratio (Q3 2026 vs. Q3 2025): 90.9% vs. 88.2% (higher loss ratio; underwriting result softened)
Ask Charlie what Cincinnati Financial’s AI tools changed in underwriting.
Cincinnati Financial: Testing The Defensive Story
Cincinnati Financial pitches itself as a diversified, defensive insurer and the latest quarter broadly fits that script. Net income of US$459 million came alongside a 90.9% P&C combined ratio, which still signals underwriting profit even with heavier catastrophe losses. Capital remains robust, with US$6.1b of parent cash and marketable securities and debt below 10% of capital. Cash generation of about US$2.1b year to date and a long dividend track record support the idea of a steady insurance and investment engine rather than a high risk turnaround story.
Profit Volatility And Cat Exposure In Focus
There is another side to this print that feeds the cautious view. Net income excluding extra items fell 59.1% year on year and the combined ratio worsened, largely because catastrophe losses added 7 points. Value creation ratio slipped 2.1% in the quarter, even though it remains positive year to date. Premium growth in core commercial and personal lines was low single digit, which can pressure operating leverage if competition keeps intensifying. For investors worried about earnings swings from weather and litigation, these trends keep those risks very visible.
Reveal where the calm surface on Cincinnati Financial's recent 2.3% move might hide a sharper turn in the next few years. Access the multi year earnings and premium growth analyst estimates for Cincinnati FinancialHunt For Quiet Dislocations
Cincinnati Financial shows how rapidly an insurance earnings narrative can change direction. The real opportunity could be in stocks where fundamentals and pricing have not yet converged.
- Company 1 - 42% below our estimate - scales coconut based beverages across retail and foodservice while expanding private label hydration offerings.
- Company 2 - 27% below our estimate - anchors digital infrastructure with high performance data movement, connectivity and security solutions for major computing clients.
- Company 3 - 26% below our estimate - sells injectable treatments for weight management and diabetes that reshape demand as new therapies advance.
Three companies from the same screener. Open all 29 potentially undervalued companies →
Have feedback on this article? Concerned about the content? Get in touch with us directly. Alternatively, email editorial-team@simplywallst.com