


EN
HASEKO (TSE:1808) Has Cooled After A Pullback, Is The Stock Now Expensive?
HASEKO (TSE:1808) has drawn fresh attention after a strong 5 year share price run, leading some investors to question how its current market value lines up with the cash the business can sustainably generate.
Recent trading has been choppy, with the share price down 7.8% over the past three months and 13.8% year to date. However, HASEKO’s 1 year total shareholder return of 10.2% and 5 year total shareholder return of 121.8% still point to strong longer term momentum.
Compare HASEKO’s mature phase valuation with other cash generative builders by scanning our hand picked list of solid balance sheet and fundamentals (23 results) for potential candidates in a similar sweet spot.
HASEKO now sits between a sharp multi year climb and a recent pullback that has cooled expectations. Is this a case of sentiment resetting, or has the share price moved ahead of what the business can reasonably earn?
Price-to-earnings of 11.2x: Is it justified?
HASEKO currently trades on a P/E of 11.2x, which leaves the stock looking more expensive than several reference points even after the recent pullback from ¥2,676.
The P/E ratio compares the company’s market value to its current earnings, so it reflects what investors are willing to pay today for each unit of profit. For a construction focused real estate group like HASEKO, this measure gives a quick read on how the market is weighing its earnings power against other listed businesses.
Relative to peers, the picture is mixed but leans toward a richer valuation. Management is working with a P/E of 11.2x, while the estimated fair P/E from the SWS model is 16x. At the same time, that 11.2x sits above the JP Consumer Durables industry average of 9.9x and the peer group average of 8.5x, so the market is already assigning HASEKO a premium versus similar builders and consumer durables stocks.
Explore the SWS fair ratio for HASEKO.
Result: Price-to-earnings of 11.2x (OVERVALUED)
Still, if condominium demand softens or construction margins come under pressure, the premium P/E multiple on HASEKO could quickly appear exposed.
Find out about the key risks to this HASEKO narrative.
Another view on HASEKO’s value
A different lens tells a cooler story. The SWS DCF model estimates HASEKO’s future cash flow value at ¥2,385.04 per share, which sits below the current ¥2,676 price. On this cash based yardstick, the stock screens as overvalued rather than cheap.
DCF work relies on long term assumptions about profits and discount rates that can shift quickly. If the model is closer to reality than the earnings multiple, how comfortable are you paying above that cash flow estimate for HASEKO?
Look into how the SWS DCF model arrives at its fair value.
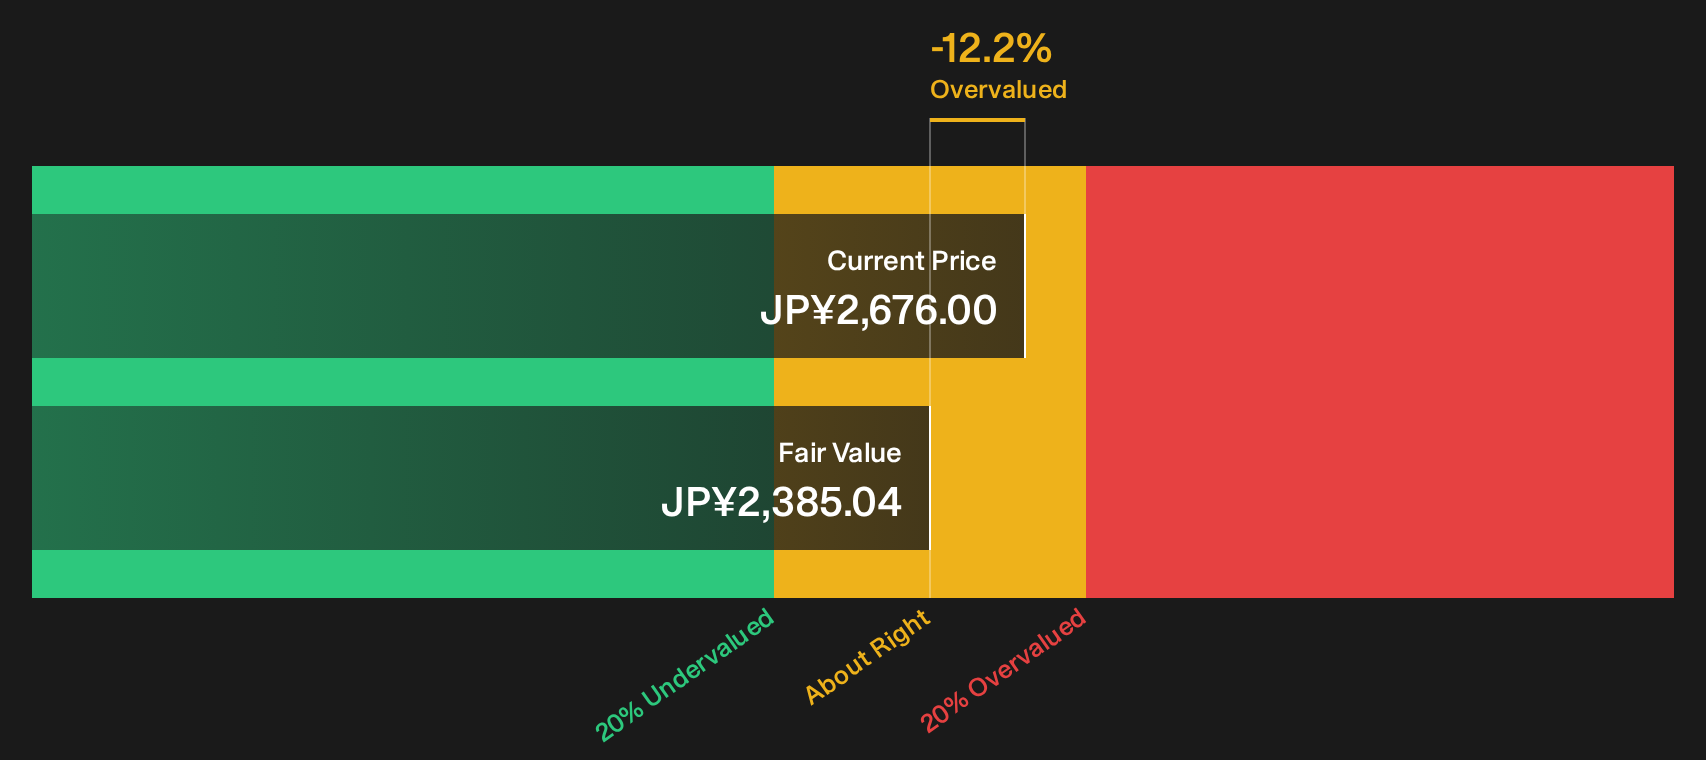
Simply Wall St performs a discounted cash flow (DCF) on every stock in the world every day (check out HASEKO for example). We show the entire calculation in full. You can track the result in your watchlist or portfolio and be alerted when this changes, or use our stock screener to discover 16 high quality undervalued stocks. If you save a screener we even alert you when new companies match - so you never miss a potential opportunity.
Next Steps
Sceptical about whether today’s mixed signals around HASEKO really tell the full story? Act promptly, review the underlying figures, and weigh both the upside potential and the issues that could hold it back with the help of 4 key rewards and 1 important warning sign
Looking for more investment ideas beyond HASEKO?
If HASEKO has sharpened your focus on valuation and quality, do not stop here. Broaden your watchlist with targeted screens that surface very different kinds of opportunities.
- Chase potential mispricing by scanning a curated basket of companies that combine quality fundamentals with appealing valuations through the 16 high quality undervalued stocks.
- Prioritise resilience by reviewing the 22 resilient stocks with low risk scores that filters for businesses with more defensive characteristics and lower overall risk scores.
- Hunt for future leaders early by checking the 72 high quality undiscovered gems that highlights lesser known stocks with strong underlying financial profiles.
Have feedback on this article? Concerned about the content? Get in touch with us directly. Alternatively, email editorial-team@simplywallst.com