


EN
PACCAR (NASDAQ:PCAR) reports sales below analyst estimates in Q3 2026 earnings

Trucking company PACCAR (NASDAQ:PCAR) missed Wall Street’s revenue expectations in Q3 2026, but revenue rose 19% year on year to $7.94 billion. Its GAAP profit of $1.61 per share was 0.7% above analysts’ consensus estimates.
For more on PACCAR, read our free full research report.
PACCAR (PCAR) Q3 2026 highlights:
- Revenue $7.94 billion vs S&P analysts’ consensus estimates of $8.21 billion (19% year-on-year growth, 3.3% miss)
- EPS (GAAP) $1.61 vs analysts’ consensus estimates of $1.60 (0.7% beat)
- Operating margin 18.9%, up from 7.6% in the same quarter last year
- Free cash flow margin 10.7%, down from 20.4% in the same quarter last year
- Market capitalization $54.94 billion
BELLEVUE, Wash.--(BUSINESS WIRE)--“PACCAR achieved excellent results in the third quarter of 2026. Revenues increased by 19% and net income increased by 44% compared to the same period last year,” said Preston Feight, chief executive officer. “The increase in quarterly profits resulted from higher truck segment margins and strong overall business performance. PACCAR Parts reported record revenues and PACCAR Financial Services achieved very good profits. I am very proud of our employees who design, build, and deliver the company’s trucks and transportation solutions to our customers.”
Revenue growth
A company’s long-term performance is an indicator of its overall quality. Any business can deliver a good quarter or two, but many enduring ones grow for years. PACCAR’s revenue grew at a tepid 5.4% annualized rate over the last five years, falling short of the industrials sector standard.
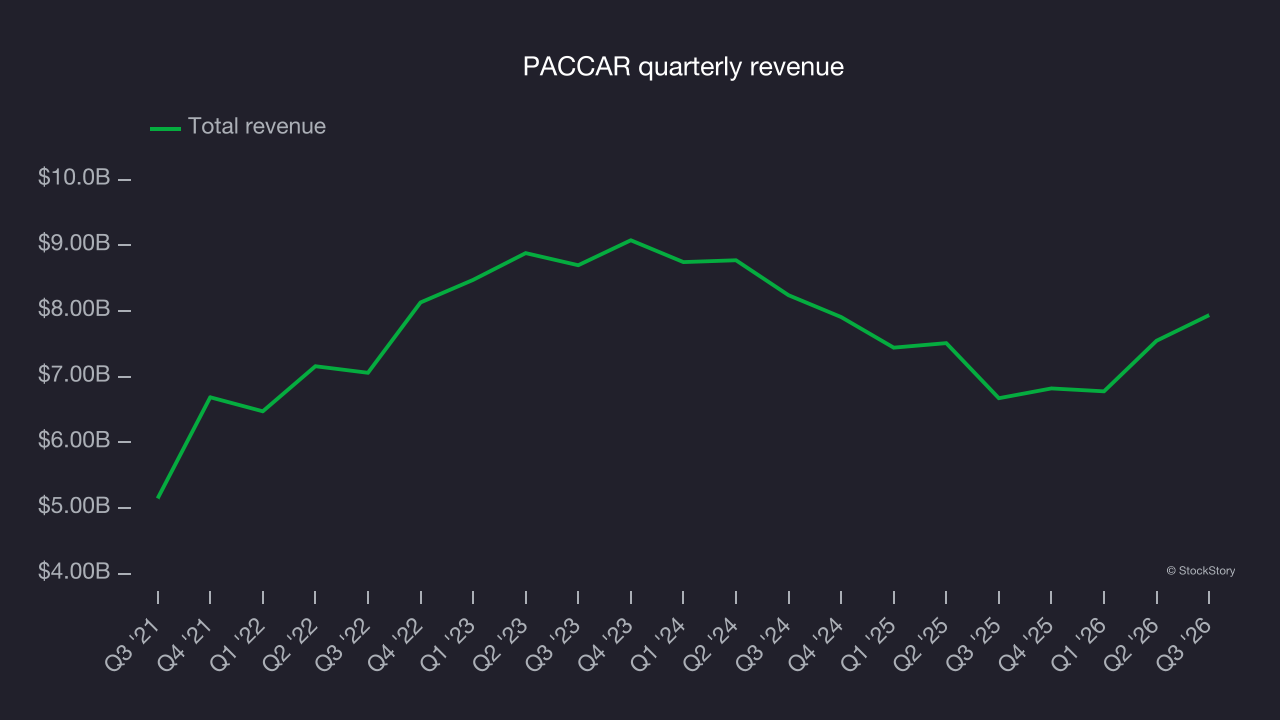
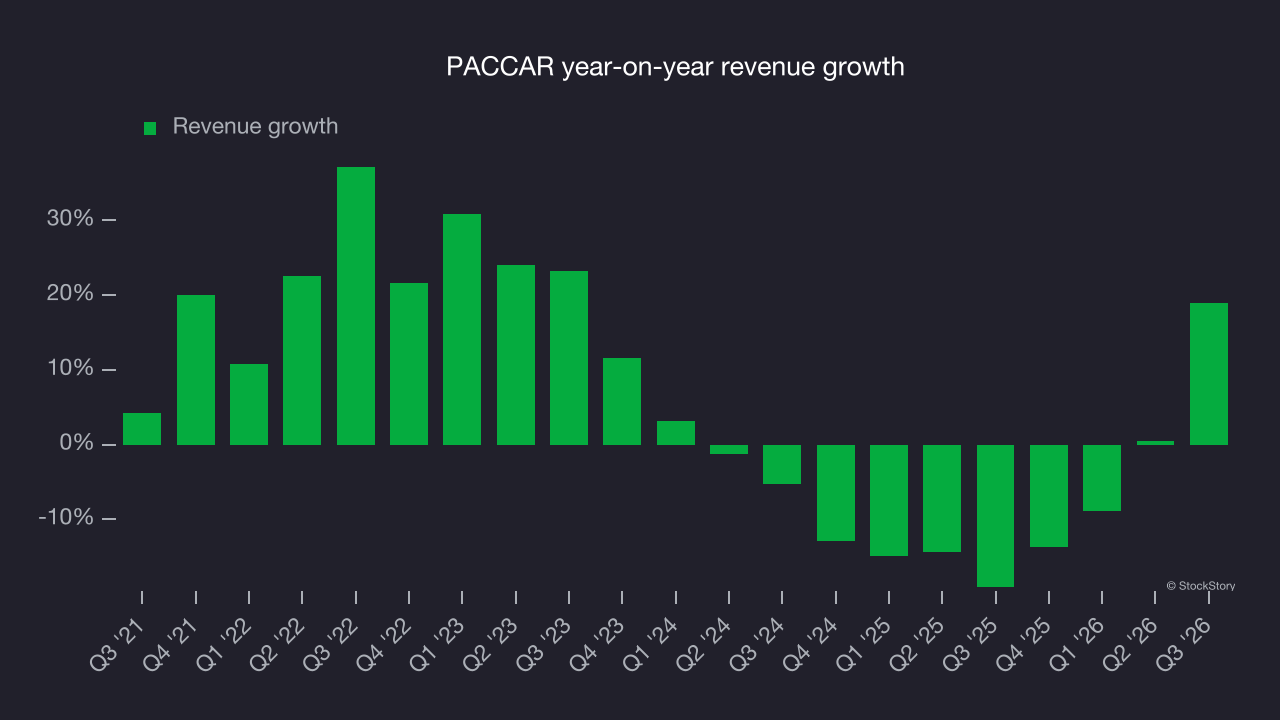
This quarter, PACCAR’s revenue grew by 19% year on year to $7.94 billion but fell short of Wall Street’s consensus estimates.
Looking ahead, sell-side analysts expect revenue to grow 13.7% over the next 12 months, according to S&P, an improvement versus the last two years. This projection is strong for a company of its scale and indicates its newer products and services will spur better revenue performance.
Operating margin
Operating margin is a key measure of profitability. Think of it as net income – the bottom line – excluding the impact of taxes and interest on debt, which are less connected to business fundamentals.
PACCAR has been an efficient company over the last five years. It was one of the more profitable businesses in the industrials sector, with an average operating margin of 12.1%. This result was particularly impressive given its low gross margin, which largely reflects what it sells and requires substantial shifts to change meaningfully. Companies have more control over their operating margins, and high operating margins alongside low gross margins are a sign of well-managed operations.
Looking at the trend in its profitability, PACCAR’s operating margin rose by 1.8 percentage points over the last five years, as its revenue growth gave it operating leverage.
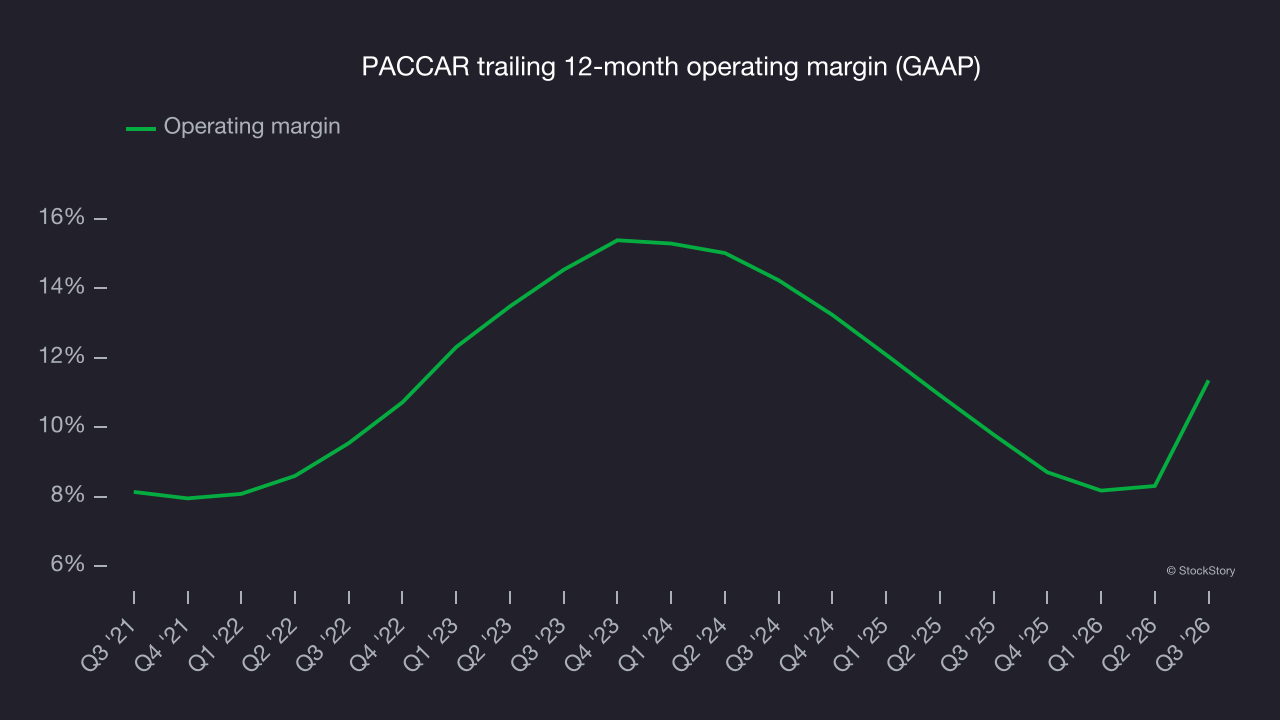
This quarter, PACCAR generated an operating margin of 18.9%, up 11.3 percentage points year on year. The increase was solid, and its operating margin outpaced its gross margin improvement, indicating greater efficiency in expenses such as marketing, R&D and administrative overhead.
Earnings per share
Revenue trends explain a company’s historical growth, but the long-term change in earnings per share (EPS) points to the profitability of that growth. For example, a company could inflate its revenue through excessive spending on advertising and promotions.
PACCAR’s EPS grew at a 9.3% compounded annual growth rate over the last five years, higher than its 5.4% annualized revenue growth. This indicates the company became more profitable on a per-share basis as it expanded.
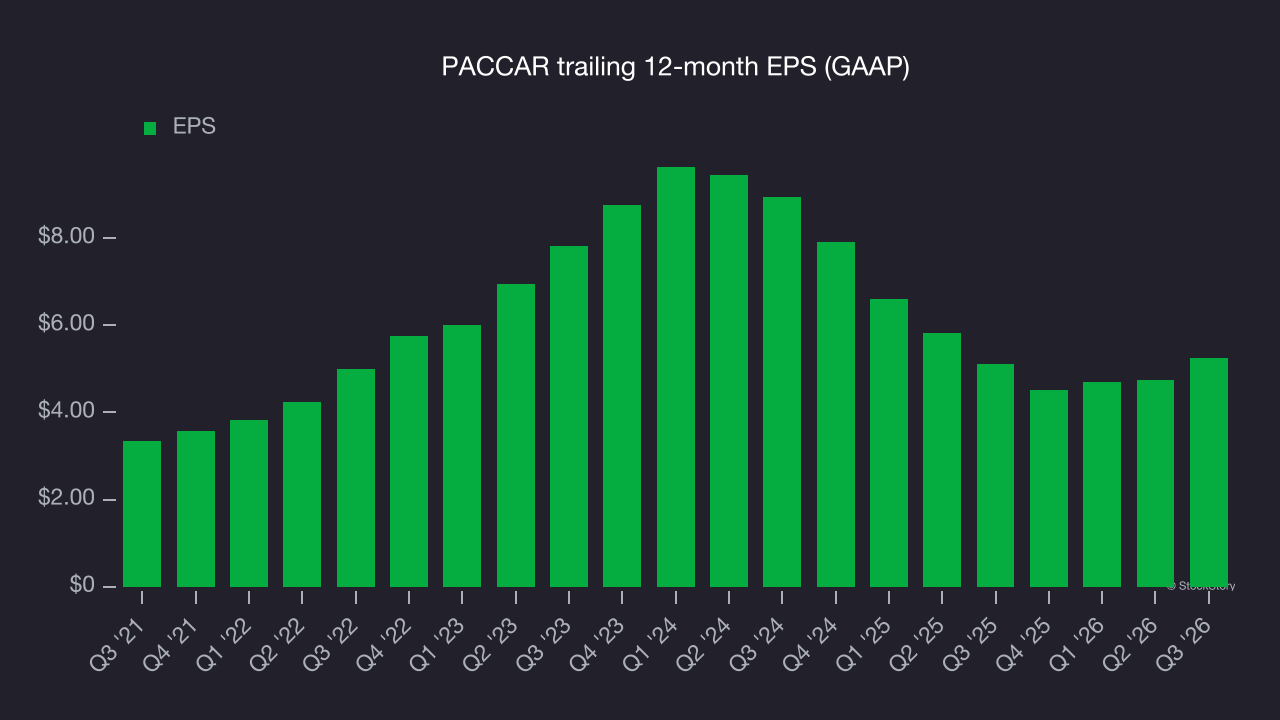
We can take a deeper look into PACCAR’s earnings to better understand the drivers of its performance. As we mentioned earlier, PACCAR’s operating margin expanded by 1.8 percentage points over the last five years. This was the most relevant factor (aside from the revenue impact) behind its higher earnings; interest expenses and taxes can also affect EPS but don’t tell us as much about a company’s fundamentals.
As with revenue, a shorter-term view of EPS can reveal changes in the business.
PACCAR’s annual EPS declines of 23.5% over the last two years mark a reversal from its five-year trend.
In Q3, PACCAR reported EPS of $1.61, up from $1.12 in the same quarter last year. This result was close to analysts’ consensus estimates. Over the next 12 months, Wall Street expects PACCAR’s full-year EPS to grow 30.9% from $5.24 to $6.86, according to S&P.
Key takeaways from PACCAR’s Q3 results
PACCAR slightly beat consensus GAAP EPS, but missed revenue expectations. The quarter was mixed. Shares rose 2.3% to $106.77 immediately after the report.
The latest quarter is only one piece of PACCAR’s longer-term business quality picture. Quality, when combined with valuation, can help determine whether the stock is a buy. For more on PACCAR, read our full research report here (it’s free).