


EN
Global Market Insights: Highlighting 3 Stocks That May Be Trading Below Fair Value
Amidst a backdrop of volatility driven by AI investment concerns and fluctuating oil prices, global markets have experienced mixed performances with small-cap and value-oriented stocks showing resilience. As investors navigate this challenging landscape, identifying stocks that may be undervalued can offer potential opportunities for those seeking to balance their portfolios. Recognizing the value in such stocks often involves assessing factors like market positioning, financial health, and growth prospects relative to current valuations.
Top 10 Undervalued Stocks Based On Cash Flows
| Name | Current Price | Fair Value (Est) | Discount (Est) |
| Valmet Oyj (HLSE:VALMT) | €27.10 | €54.02 | 49.8% |
| Thai Credit Bank (SET:CREDIT) | THB22.90 | THB45.74 | 49.9% |
| Smartsens Technology (Shanghai) (SHSE:688213) | CN¥101.63 | CN¥215.82 | 52.9% |
| P&H Tech (KOSDAQ:A239890) | ₩3110.00 | ₩6197.65 | 49.8% |
| PAL GROUP Holdings (TSE:2726) | ¥1479.00 | ¥2922.79 | 49.4% |
| Nissei ASB Machine (TSE:6284) | ¥8000.00 | ¥15771.63 | 49.3% |
| Natural Food International Holding (SEHK:1837) | HK$1.41 | HK$2.80 | 49.6% |
| Kissei Pharmaceutical (TSE:4547) | ¥3825.00 | ¥7679.17 | 50.2% |
| Henan Mingtai Al.IndustrialLtd (SHSE:601677) | CN¥14.43 | CN¥28.14 | 48.7% |
| ENN Energy Holdings (SEHK:2688) | HK$49.38 | HK$97.32 | 49.3% |
Let's dive into some prime choices out of the screener.
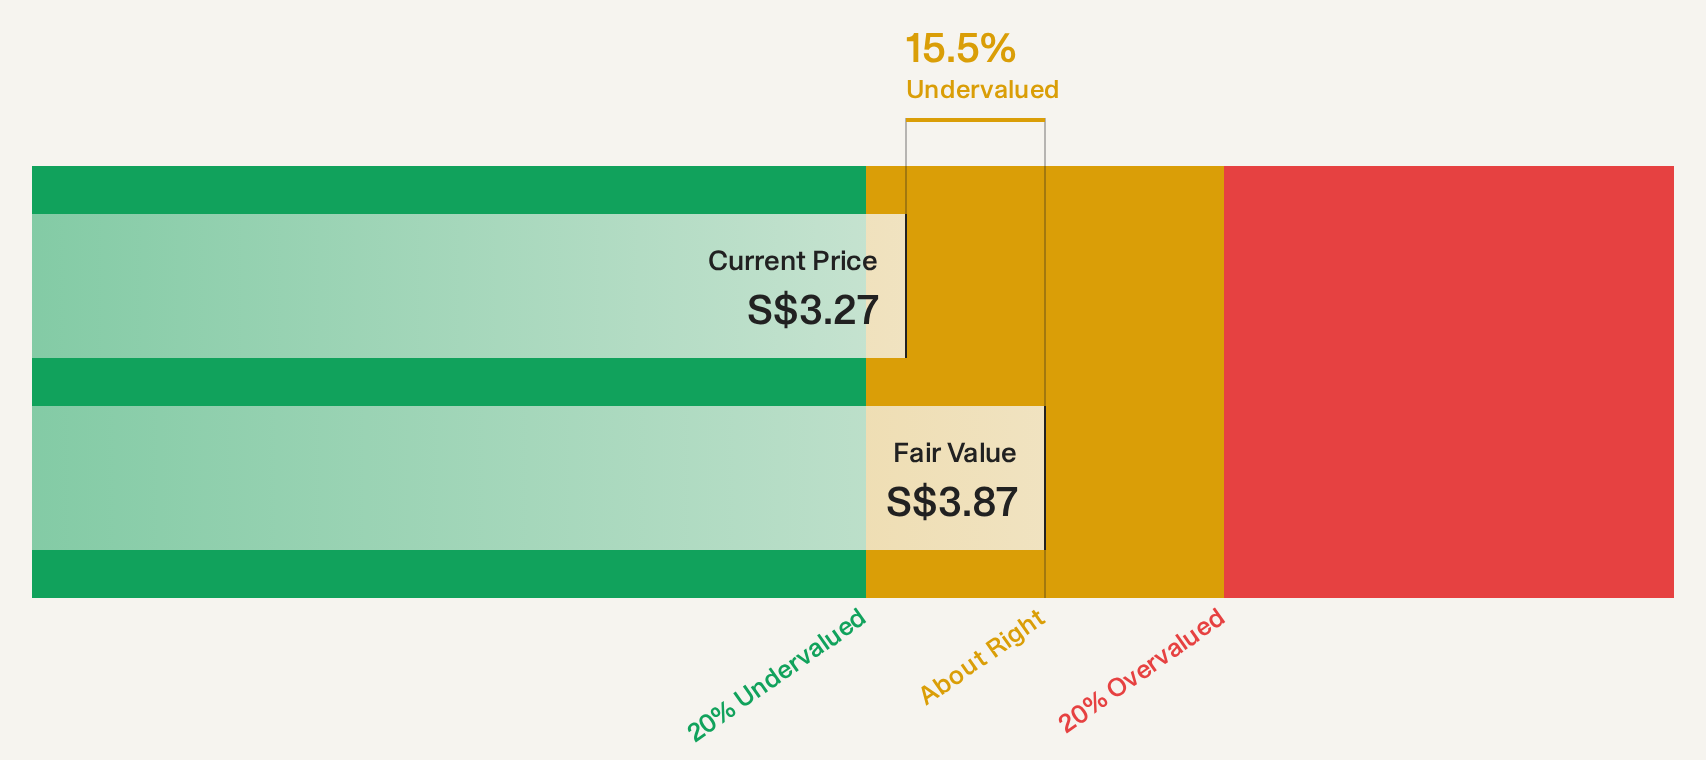
UOB-Kay Hian Holdings (SGX:U10)
Overview: UOB-Kay Hian Holdings Limited is an investment holding company offering services such as stockbroking, futures broking, structured lending, investment trading, margin financing, and research services with a market cap of SGD2.94 billion.
Operations: The company's revenue is primarily derived from its Securities and Futures Broking and Other Related Services segment, which generated SGD845.48 million.
Estimated Discount To Fair Value: 23%
UOB-Kay Hian Holdings reported a strong net income of S$164.74 million for the half year ending June 2026, up from S$99.23 million last year. Despite this growth, earnings are forecasted to increase slowly at 2.4% annually, below market expectations. The stock trades at 23% below its fair value estimate and is undervalued based on discounted cash flow analysis, though insider selling raises caution and dividends aren't well covered by free cash flows.
- Our growth report here indicates UOB-Kay Hian Holdings may be poised for an improving outlook.
- Unlock comprehensive insights into our analysis of UOB-Kay Hian Holdings stock in this financial health report.
Elan (TSE:6099)
Overview: Elan Corporation operates in the nursing care business primarily in Japan, with a market cap of ¥44.58 billion.
Operations: The company generates revenue from its Nursing Care and Medical Services segment, amounting to ¥58.13 billion.
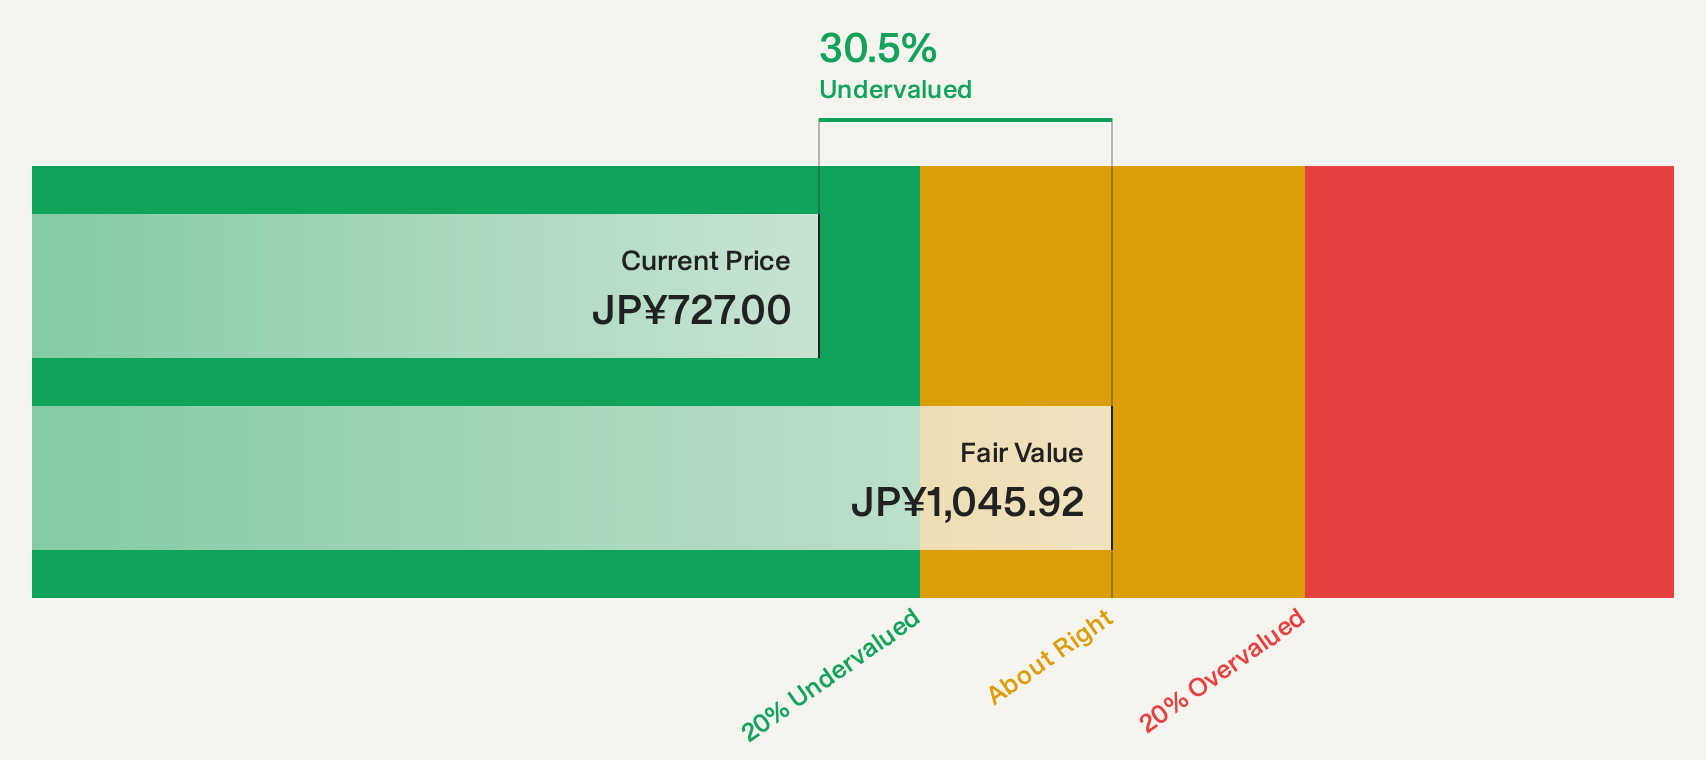
Estimated Discount To Fair Value: 30%
Elan trades at ¥732, significantly below its estimated future cash flow value of ¥1045.92, indicating undervaluation. Despite a forecasted earnings growth of 9% annually, which is slightly below the JP market's 9.4%, its revenue growth surpasses the market average at 10.5%. The stock is priced attractively compared to peers and industry benchmarks, though Return on Equity is expected to be low in three years at 19%.
- Our earnings growth report unveils the potential for significant increases in Elan's future results.
- Take a closer look at Elan's balance sheet health here in our report.
Osaki Electric (TSE:6644)
Overview: Osaki Electric Co., Ltd. is involved in the development, manufacturing, sales, and installation of meters across Japan and various international markets, with a market cap of ¥57.64 billion.
Operations: The company's revenue segments include Smart Meters & Solutions in Japan generating ¥60.57 billion and Smart Meters & Solutions Overseas contributing ¥41.54 billion, with an additional ¥407 million from Real Estate.
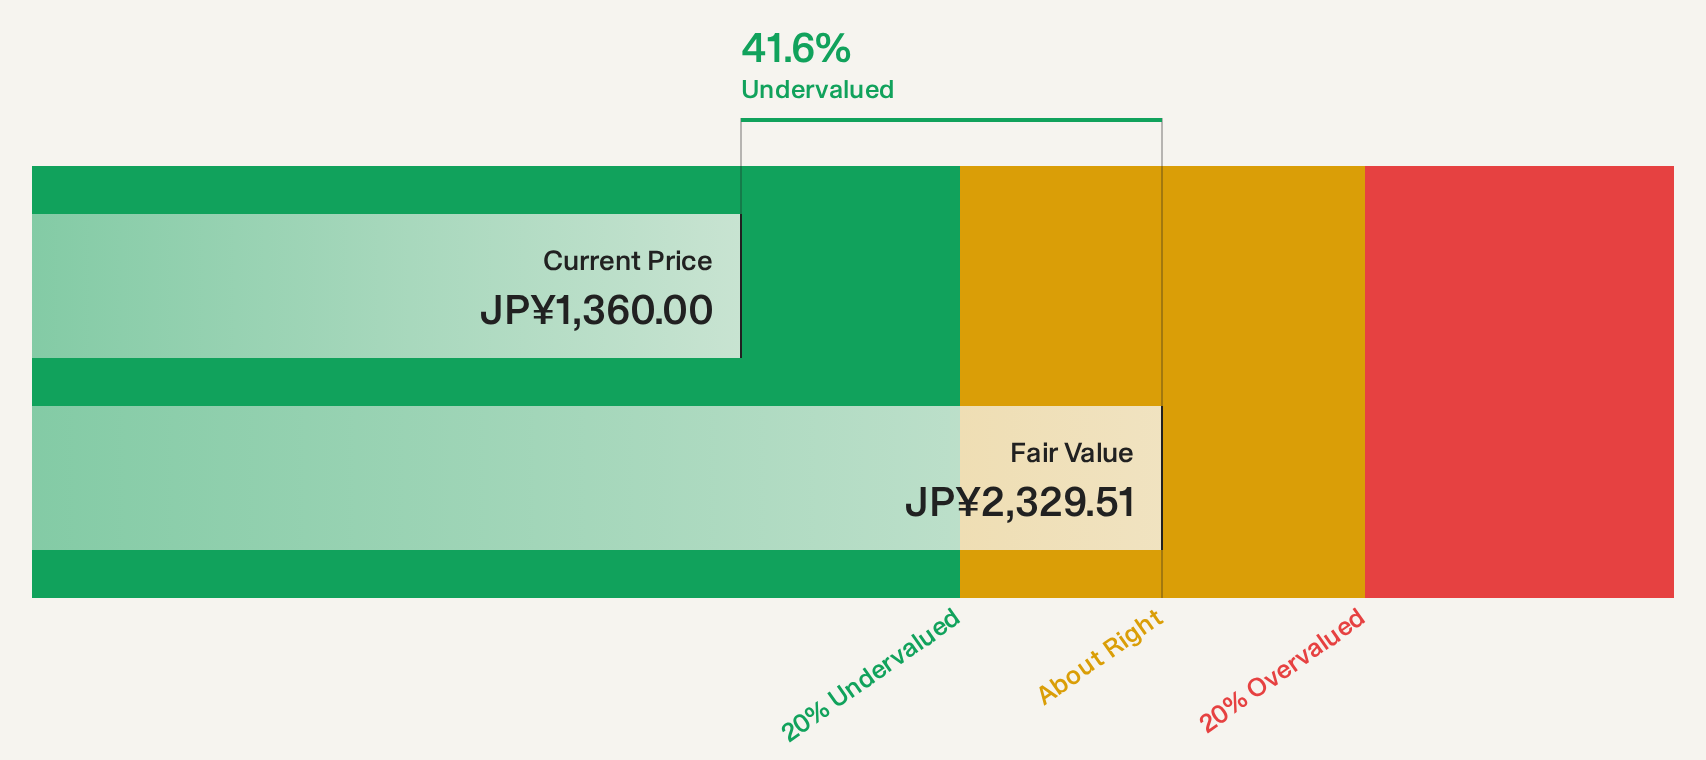
Estimated Discount To Fair Value: 42.2%
Osaki Electric is trading at ¥1,354, well below its estimated future cash flow value of ¥2,341.25, highlighting potential undervaluation. Despite a forecasted earnings decline of 3.2% annually over the next three years and slower revenue growth than the JP market, it offers reliable dividends at 3.62%. Recent buybacks totaling ¥2.42 billion enhance shareholder value while recent earnings show significant improvement with net income rising to ¥1,183 million from ¥350 million year-on-year.
- Upon reviewing our latest growth report, Osaki Electric's projected financial performance appears quite optimistic.
- Get an in-depth perspective on Osaki Electric's balance sheet by reading our health report here.
Seize The Opportunity
- Delve into our full catalog of 263 Undervalued Global Stocks Based On Cash Flows here.
- Have you diversified into these companies? Leverage the power of Simply Wall St's portfolio to keep a close eye on market movements affecting your investments.
- Discover a world of investment opportunities with Simply Wall St's free app and access unparalleled stock analysis across all markets.
Contemplating Other Strategies?
- Explore high-performing small cap companies that haven't yet garnered significant analyst attention.
- Diversify your portfolio with solid dividend payers offering reliable income streams to weather potential market turbulence.
- Fuel your portfolio with companies showing strong growth potential, backed by optimistic outlooks both from analysts and management.
This article by Simply Wall St is general in nature. We provide commentary based on historical data and analyst forecasts only using an unbiased methodology and our articles are not intended to be financial advice. It does not constitute a recommendation to buy or sell any stock, and does not take account of your objectives, or your financial situation. We aim to bring you long-term focused analysis driven by fundamental data. Note that our analysis may not factor in the latest price-sensitive company announcements or qualitative material. Simply Wall St has no position in any stocks mentioned.
Have feedback on this article? Concerned about the content? Get in touch with us directly. Alternatively, email editorial-team@simplywallst.com