


EN
Park National (PRK) Beats Third Quarter Estimates, Is The Premium P/E Still Too Rich?
Park National (PRK) is back in focus after releasing third quarter 2026 results, with revenue, net income and key banking metrics all coming in ahead of analyst expectations.
At a share price of $183.32, Park National has logged an 18.79% year to date share price return. The recent 3.15% 7 day gain suggests that investors are reacting positively to the earnings beat, even though the 90 day share price return is down 11.43%.
See how Park National’s earnings surprise fits into the broader regional banking story by comparing it with our curated list of 30 resilient stocks with low risk scores that also focus on balance sheet resilience and consistency.
Park National has just delivered an earnings beat and a sharp year to date gain, yet the share price is still lagging its recent peak. Do you lean into the current setup, or wait for a cheaper shot at it, as the valuation section starts to unpack that trade off?
Preferred P/E of 17.4x: Is it justified for Park National?
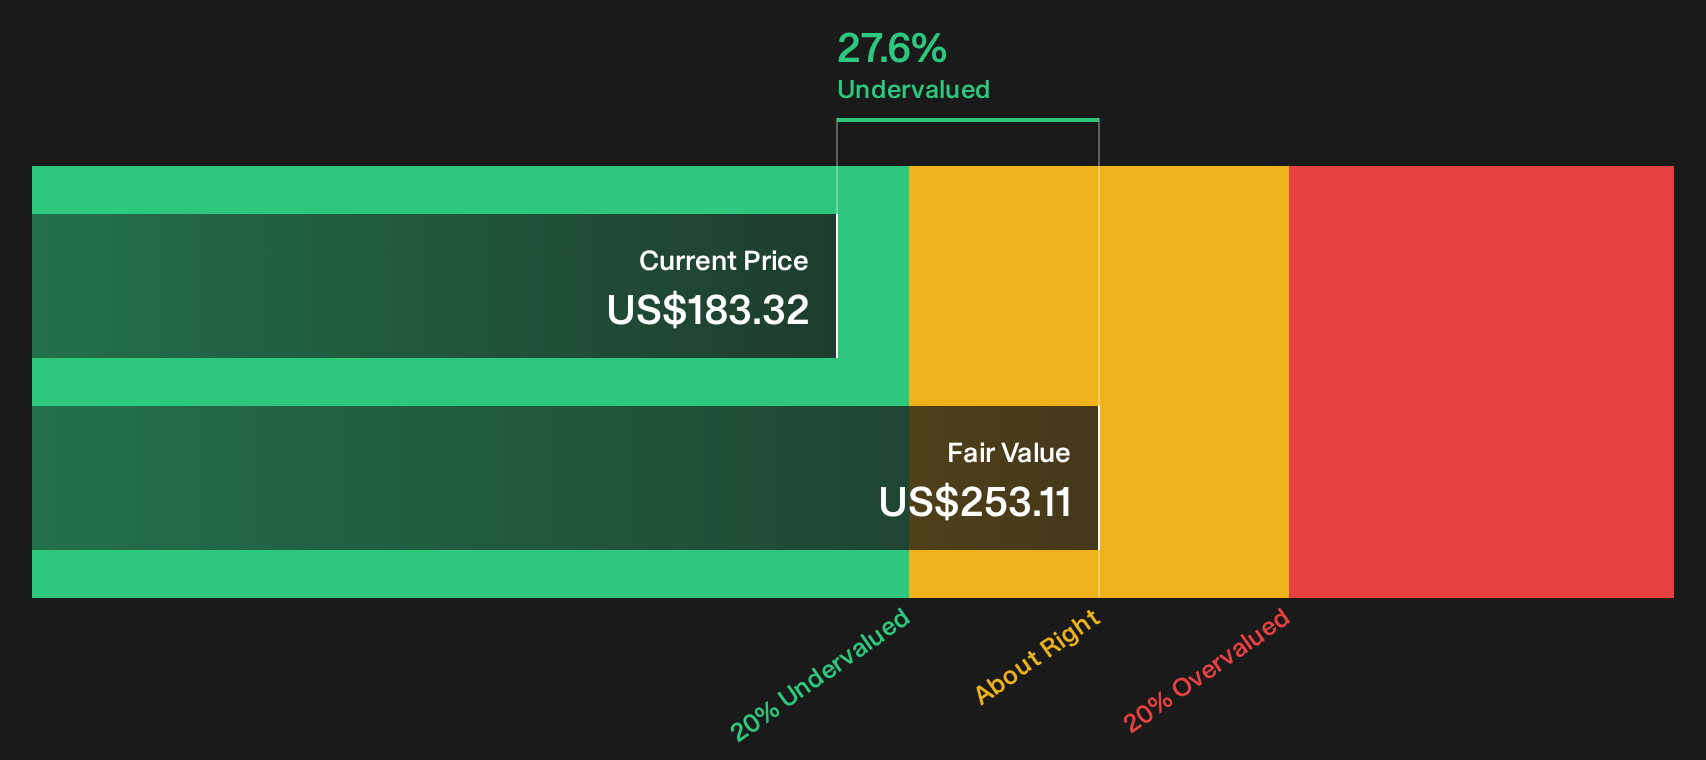
On valuation, Park National trades on a P/E of 17.4x, which sits above both the US Banks industry and its closest peer group, even though the shares are 27.6% below one estimate of fair value based on future cash flows.
The P/E ratio compares the current share price to earnings per share, so for a bank like Park National it effectively shows how much investors are paying for each dollar of profit. A higher multiple often reflects expectations that earnings will be resilient or improve, while a lower figure can suggest the market is more cautious.
PRK's earnings have grown 3.4% per year over the past 5 years and 13.8% over the past year, and forecasts point to earnings growth of 11.13% per year. Those figures are slower than the broader US market forecast of 17% per year, and the stock is described as expensive relative to an estimated fair P/E of 12.5x, which is a level the market could move towards if enthusiasm cools.
Compared with the US Banks industry average P/E of 11.5x and a peer average of 14.7x, Park National changes hands at a meaningfully richer earnings multiple. That gap, combined with a fair P/E estimate of 12.5x, suggests the current 17.4x valuation is stretching well beyond both sector norms and the level implied by the fair ratio.
Explore the SWS fair ratio for Park National.
Result: Price-to-earnings of 17.4x (OVERVALUED)
Still, Park National faces real pressure points if credit quality worsens or loan growth slows. This could challenge the current earnings profile and the premium P/E story.
Find out about the key risks to this Park National narrative.
Another view on Park National’s value
There is a sharp twist when shifting from the P/E discussion to our DCF work. The SWS DCF model estimates Park National’s future cash flows are worth about $253.11 per share, which is above the current $183.32 price and points to an undervalued setup instead.
That gap between a premium earnings multiple and a discounted cash flow signal leaves you with a simple question: Which lens do you trust more when the story gets bumpy next?
Look into how the SWS DCF model arrives at its fair value.
Simply Wall St performs a discounted cash flow (DCF) on every stock in the world every day (check out Park National for example). We show the entire calculation in full. You can track the result in your watchlist or portfolio and be alerted when this changes, or use our stock screener to discover 29 high quality undervalued stocks. If you save a screener we even alert you when new companies match - so you never miss a potential opportunity.
Next Steps
Sentiment in this Park National update is mixed, so do not let the headline takeaway be your only guide. Instead, test the numbers yourself. To see what investors are optimistic about, review the 4 key rewards
Looking for more Park National style investment ideas?
If Park National has you thinking more broadly about where to put fresh capital, do not stop here. Use the Simply Wall Street screener to pressure test other opportunities, compare quality across sectors, and build a watchlist that reflects how you want your money to work.
- Hunt for quality at a sensible entry point by running the 29 high quality undervalued stocks screener, which filters for strong fundamentals at prices that may not fully reflect them.
- Strengthen your income stream by scanning the 5 dividend fortresses screener and focusing on companies with higher yields that complement a bank like Park National.
- Sleep easier through volatility by checking the list of solid balance sheet and fundamentals (24 results) screener so your shortlist leans toward financially resilient businesses.
Have feedback on this article? Concerned about the content? Get in touch with us directly. Alternatively, email editorial-team@simplywallst.com