


EN
TISI (TSE:3626) Just Drew Fresh Attention, What Is The Market Missing?
Huawei’s new AI CITY Development Research Report 2026 and the launch of the Global AI CITY Innovation & Development Ecosystem Alliance put TISI (TSE:3626) directly into a global smart urban infrastructure conversation.
Recent trading shows momentum rebuilding in TISI, with a 1‑month share price return of 13.0% and a 90‑day gain of 20.86%. However, the year to date share price is still down 12.36% and the 1‑year total shareholder return has declined 9.59%, while holders over three and five years have seen total shareholder returns of 52.20% and 56.68% respectively.
Scan beyond TISI and this Huawei alliance by reviewing hand picked 55 AI infrastructure stocks that are poised to shape the next wave of intelligent city infrastructure and digital public services.
TISI has bounced hard in the short term yet still trails on a 1-year view. Does that reset leave more upside potential, or does it skew the risk toward disappointment, as the valuation section spells out next?
Preferred P/E of 19.6x: Is it justified for TISI?
TISI trades on a P/E of 19.6x, which implies investors are paying a moderate premium for each yen of earnings relative to parts of the market.
The P/E ratio compares the current share price to earnings per share. For an IT services provider like TISI, it is a common way for investors to weigh what they pay today against the profit the business is already producing.
Here the picture splits. The stock is described as good value against an estimated fair P/E of 24x and also against a peer average of 24.8x, which suggests the current valuation does not fully match that fair ratio level the market could move towards. At the same time, the multiple is labelled expensive versus the broader JP IT industry on 16.4x, so buyers are paying more than the sector average for earnings that are forecast to grow 7.5% per year, slower than the 9.5% forecast for the wider JP market.
That mix points to a company where the market assigns a higher tag than the industry as a whole, potentially for its high quality earnings and 6.8% per year earnings growth over the past 5 years. Yet it is still priced below what the SWS fair ratio model suggests. In plain terms, investors are paying more than for the typical IT stock but are not fully reflecting the profile implied by the fair P/E ratio.
Explore the SWS fair ratio for TISI.
Result: Price-to-earnings of 19.6x (ABOUT RIGHT)
Still, the recent share price rebound sits against a 1‑year decline and a premium to the wider JP IT sector, so any earnings wobble or weaker contract flow could quickly cool enthusiasm around TISI.
Find out about the key risks to this TISI narrative.
Another view of TISI’s value
The P/E story points to a roughly fair price for TISI, yet the SWS DCF model paints a different picture. On that cash flow view, the stock at ¥4,537 trades about 10.8% below an estimated value of ¥5,087.28. That gap raises a simple question: Is the market underestimating how durable those future cash flows could be?
Look into how the SWS DCF model arrives at its fair value.
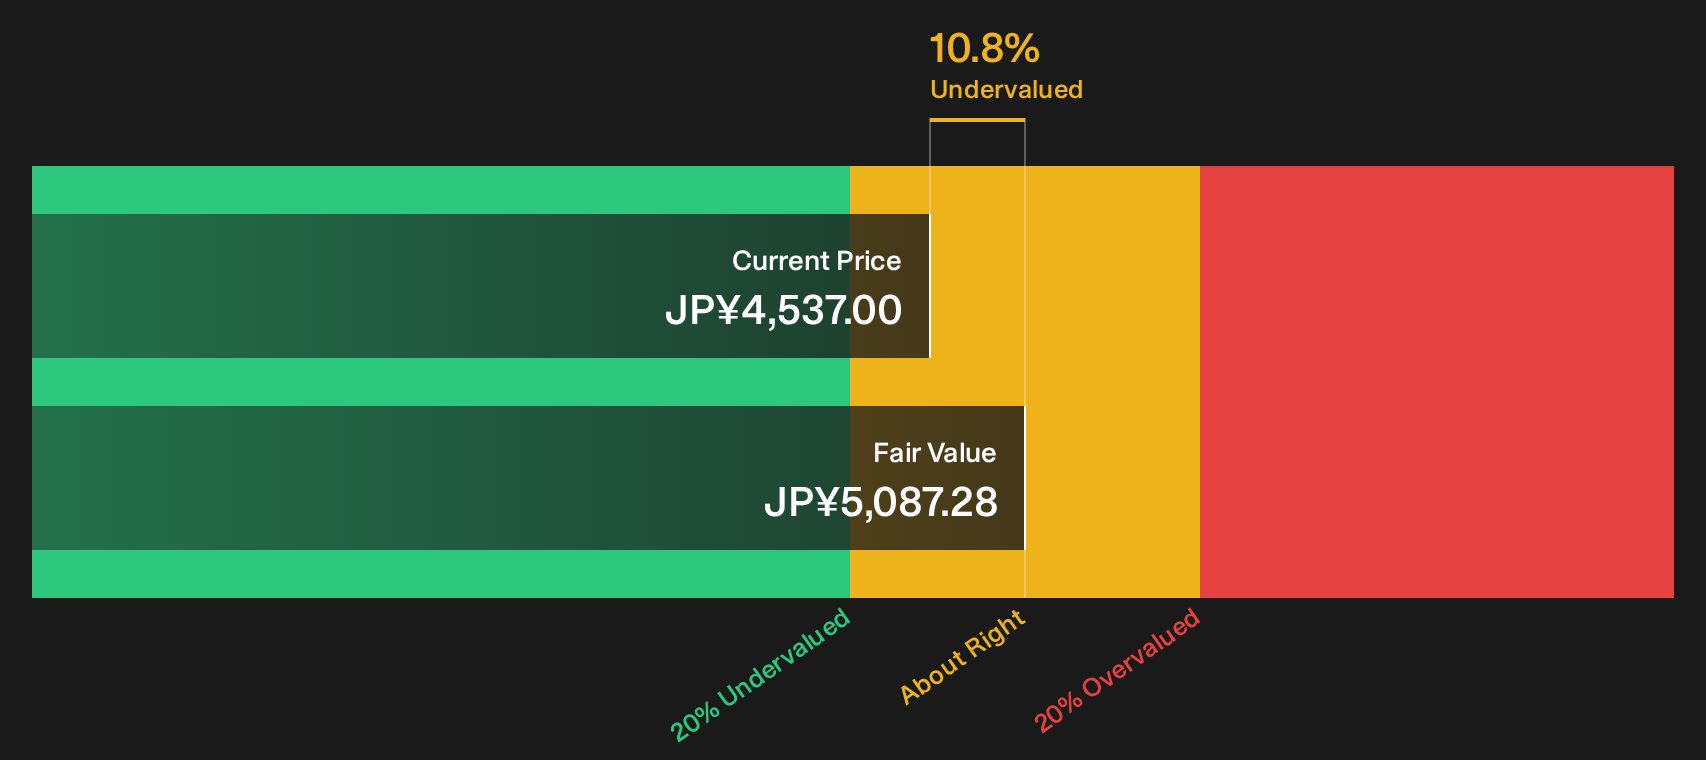
Simply Wall St performs a discounted cash flow (DCF) on every stock in the world every day (check out TISI for example). We show the entire calculation in full. You can track the result in your watchlist or portfolio and be alerted when this changes, or use our stock screener to discover 16 high quality undervalued stocks. If you save a screener we even alert you when new companies match - so you never miss a potential opportunity.
Next Steps
Curious whether the optimism around TISI truly aligns with your own expectations and risk appetite? Act while the data is fresh and pressure test the story against the 3 key rewards
Looking for more TISI investment ideas?
If TISI has sparked fresh questions, use that curiosity and broaden your watchlist with a few focused stock shortlists built around different strengths.
- Target potential mispricing by scanning for companies that combine quality fundamentals with attractive valuations through the 16 high quality undervalued stocks.
- Prioritise resilience by reviewing a list of solid balance sheet and fundamentals (23 results) that can help you filter for sturdier cash positions and lower financial strain.
- Hunt for fresh stories by checking a 72 high quality undiscovered gems that might not yet be crowded but already show solid underlying metrics.
Have feedback on this article? Concerned about the content? Get in touch with us directly. Alternatively, email editorial-team@simplywallst.com