


EN
Storebrand (OB:STB) Could Be 41% Undervalued Following Weaker Q3 Results And 2026 Dividend Plan
Storebrand (OB:STB) has just combined softer third quarter earnings with a fresh dividend signal that matters for anyone watching the stock. Net income and earnings per share declined year over year, yet the board still plans a 2026 payout.
Storebrand’s third quarter update and planned 2026 dividend land after a mixed run in the share price, with the stock at NOK191.6 and short term momentum softer while multi year total shareholder returns remain strong. This hints that long term holders have still been rewarded despite the recent earnings dip and the new Additional Tier 1 bond issue slightly reshaping the group’s capital structure.
Scan how Storebrand compares with other dividend focused financials and see which peers are already pricing in similar earnings pressure via our curated 224 dividend fortresses
Storebrand now trades below both analyst targets and one intrinsic value estimate, despite weaker profits and a planned NOK6 payout. Is this a cautious market that is rightly sceptical, or a discount that the numbers can support?
Price-to-Earnings of 17.9x: Is It Justified for Storebrand?
Storebrand looks inexpensive against one intrinsic value estimate, yet its P/E of 17.9x tells a different story when you compare it with listed insurers. The latest close at NOK191.6 sits below an internal fair value model, while the same equity trades on a richer multiple than both local and regional peers.
The P/E ratio compares what you pay per share with the earnings that Storebrand generates today. For an insurance business, this is a simple way to see how much of the future profit story is already reflected in the Nok price, especially when headline earnings growth has recently declined.
On a pure peer comparison, the stock carries a meaningful premium. Storebrand trades at 17.9x earnings, while similar Norwegian insurers sit around 12x and the broader European insurance group is closer to 12.7x. Yet against an estimated fair P/E of 18.1x, the current multiple lines up closely with what the SWS fair ratio suggests the market could eventually gravitate toward.
Explore the SWS fair ratio for Storebrand.
Result: Price-to-Earnings of 17.9x (OVERVALUED)
Still, Storebrand faces clear pressure points if revenue growth continues to decline and the NOK6 dividend plan tightens flexibility around future capital needs.
Find out about the key risks to this Storebrand narrative.
Another View: Storebrand Through A Cash Flow Lens
The P/E premium paints Storebrand as expensive, yet the SWS DCF model points the other way. On that framework, NOK191.6 compares to an estimated future cash flow value of NOK324.7, which implies the shares screen as materially undervalued. Which signal should carry more weight for you?
Look into how the SWS DCF model arrives at its fair value.
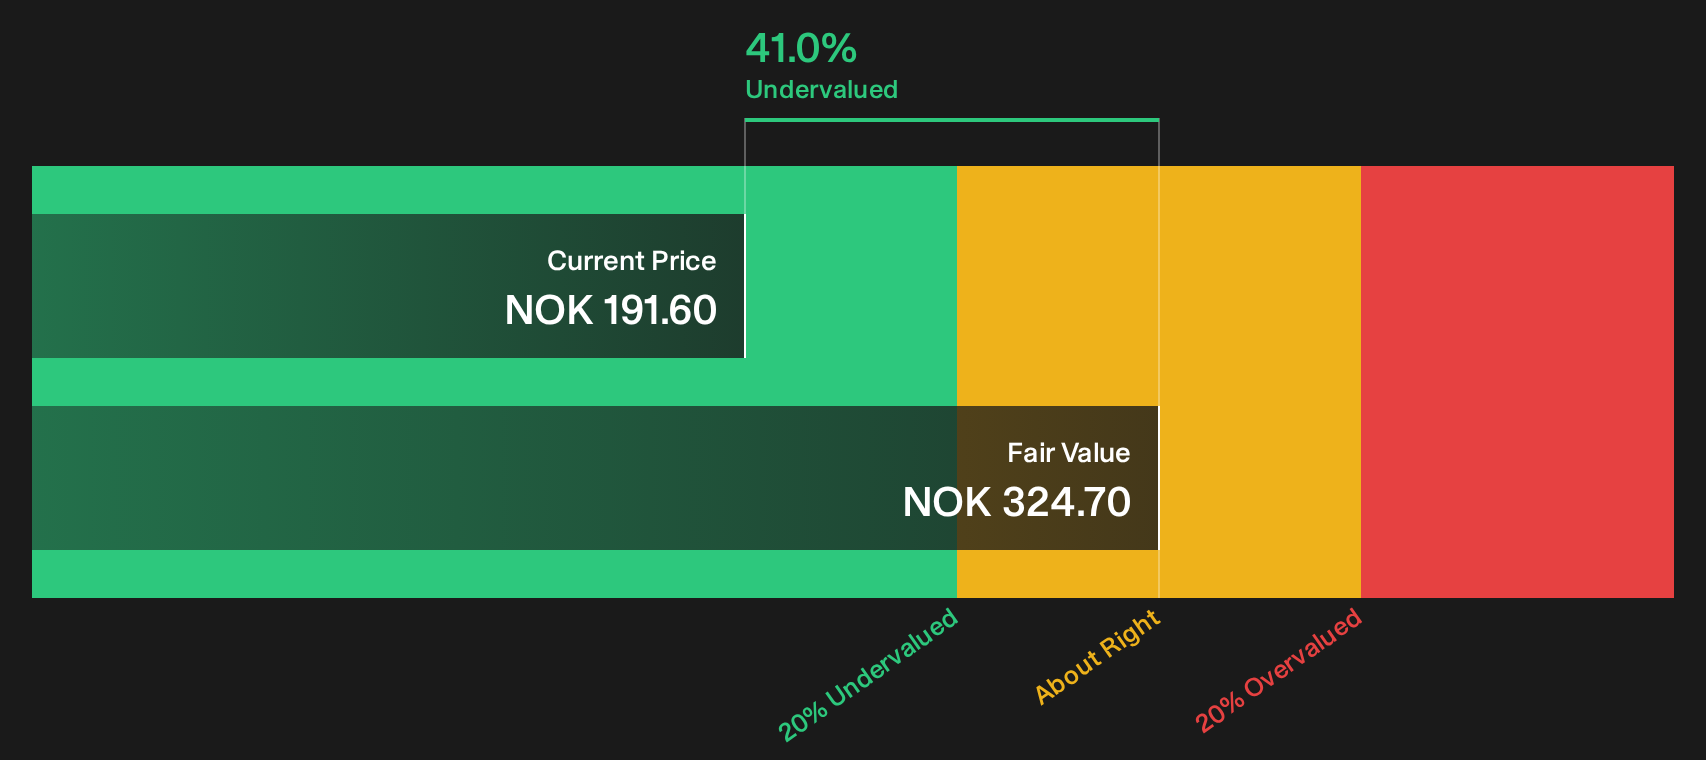
Simply Wall St performs a discounted cash flow (DCF) on every stock in the world every day (check out Storebrand for example). We show the entire calculation in full. You can track the result in your watchlist or portfolio and be alerted when this changes, or use our stock screener to discover 195 high quality undervalued stocks. If you save a screener we even alert you when new companies match - so you never miss a potential opportunity.
Next Steps
Mixed messages on valuation and earnings can easily blur the picture for Storebrand. Act quickly, examine the data for yourself, and pressure test both the upside and the downside by running through the 2 key rewards and 2 important warning signs.
Looking for more Storebrand sized investment ideas?
If Storebrand has you thinking harder about price, quality and income, do not stop here. Broaden your watchlist now or risk missing sharper opportunities.
- Spot potential mispricing early by scanning the 195 high quality undervalued stocks that pair solid fundamentals with what may be discounted share prices.
- Strengthen your core holdings with the list of solid balance sheet and fundamentals (207 results) that highlight financially resilient businesses built on sturdier capital foundations.
- Get ahead of the crowd by reviewing the 610 high quality undiscovered gems that focus on quality companies receiving limited market attention so far.
Have feedback on this article? Concerned about the content? Get in touch with us directly. Alternatively, email editorial-team@simplywallst.com