


EN
Can China Power International Development (SEHK:2380) Justify Its Valuation On The New BESS Deal?
What the new BESS agreements mean for China Power International Development
China Power International Development (SEHK:2380) has signed a multi year framework with SPIC to supply battery energy storage systems and services, running through 2028 and aligned with publicly tendered green power projects.
The arrangement covers integrated BESS equipment, technical support and a structured approach to pricing. This gives the utility a formal channel to compete for future storage contracts within the wider SPIC Group.
Recent trading has been choppy for China Power International Development, with the share price slipping over the year to date and recording a 7 day share price return of down 4.02%, even though the 3 year total shareholder return is slightly positive at 2.00%. The HK$2.625 latest share price and 1 day share price return of 0.96% suggest short term interest picked up around the BESS framework news. However, momentum over longer horizons remains muted as investors weigh new contracts against the stock’s weaker 1 year total shareholder return of down 18.68% and a 5 year total shareholder return of down 17.61%.
Scan how China Power International Development compares with other grid and energy-transition plays by reviewing the hand picked 42 power grid technology and infrastructure stocks in this space.
For China Power International Development, the question now is whether the latest bump reflects investors finally pricing in the BESS framework or just a brief sentiment swing that leaves the valuation story largely unchanged.
Preferred P/E of 17.3x for China Power International Development: Is it justified?
At the current HK$2.625 share price, China Power International Development trades on a P/E of 17.3x, which is higher than both its peer group and the wider Asian renewable energy space. That premium sits uncomfortably next to a one-year total shareholder return that has declined 18.68% and revenue that slipped 0.7% on an annual basis.
P/E compares what you pay today for each unit of profit the business generates. For a power producer that spans coal, hydro, wind, solar and energy storage, investors often use this yardstick to judge how much of the earnings outlook is already reflected in the share price.
The tension here is clear. Forecasts indicate earnings growth of 21.9% per year over the next three years, compared with a 10.6% gain expected for the Hong Kong market. However, margins compressed from 6.3% to 3% and return on equity is only 3.6%, with projections of 5.1% in three years. Against an estimated fair P/E of 12.5x, the current 17.3x appears elevated and signals a level many investors may expect the valuation to drift back toward if profitability does not improve meaningfully.
China Power International Development also screens as expensive relative to both the Asian renewable energy industry P/E of 13.7x and a peer average of 6.5x. This gap suggests the stock is pricing in a cleaner earnings trajectory than the sector or its closest comparables, even though reported earnings fell 52.8% over the past year and interest cover is described as weak.
Explore the SWS fair ratio for China Power International Development.
Result: Price-to-earnings of 17.3x (OVERVALUED)
Still, the valuation story for China Power International Development could unravel if further earnings weakness, margin pressure, or project setbacks challenge the premium P/E investors are currently paying.
Find out about the key risks to this China Power International Development narrative.
Another view on China Power International Development’s value
The P/E workup presents China Power International Development as expensive, yet the SWS DCF model points in the opposite direction. At HK$2.63, the stock is described as trading about 72.7% below an estimated future cash flow value of HK$9.61, which implies a very different balance of risk and potential reward. Which signal do you rely on more when the cash flow story and the earnings multiple move in opposite directions?
Look into how the SWS DCF model arrives at its fair value.
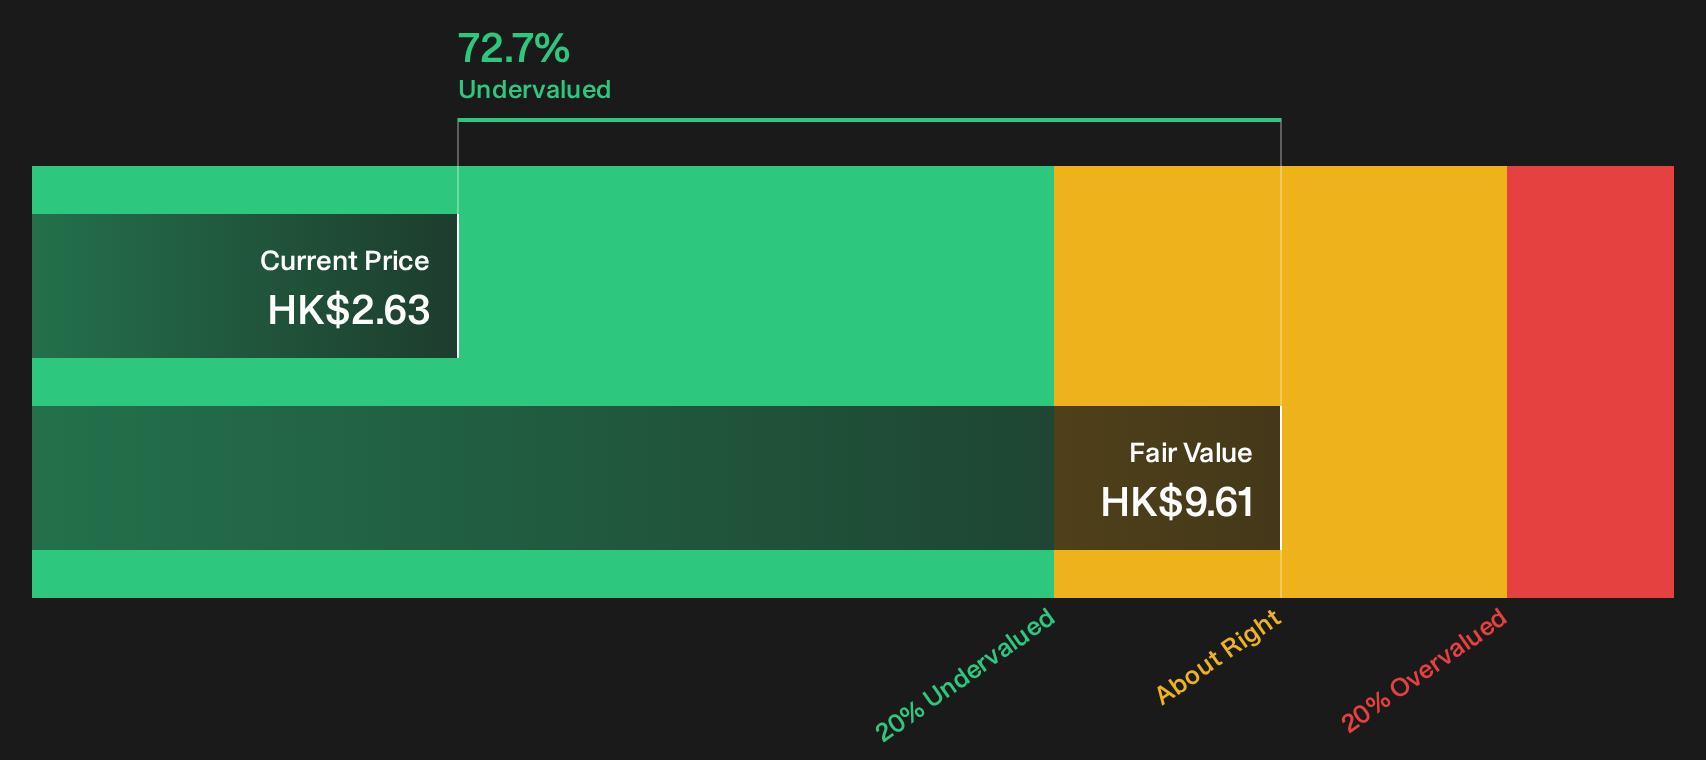
Simply Wall St performs a discounted cash flow (DCF) on every stock in the world every day (check out China Power International Development for example). We show the entire calculation in full. You can track the result in your watchlist or portfolio and be alerted when this changes, or use our stock screener to discover 194 high quality undervalued stocks. If you save a screener we even alert you when new companies match - so you never miss a potential opportunity.
Next Steps
Mixed signals around China Power International Development can be confusing, so it may help to review the numbers yourself and consider how they fit your investment approach. To weigh both sides of the story, begin by looking at the balance between the 2 key rewards and 3 important warning signs.
Looking for more investment ideas beyond China Power International Development?
If China Power International Development has sharpened your focus on valuation and risk, do not stop there. The screener can surface other opportunities that fit your style.
- Target steadier potential outcomes by reviewing 223 resilient stocks with low risk scores that score well on resilience and risk controls.
- Hunt for quality at a discount by scanning 70 high quality undervalued stocks built around solid fundamentals and attractive pricing.
- Spot potential future leaders early by checking 610 high quality undiscovered gems with strong underlying metrics before attention catches up.
Have feedback on this article? Concerned about the content? Get in touch with us directly. Alternatively, email editorial-team@simplywallst.com