


EN
Pan Pacific International Holdings (TSE:7532) Sales Growth Keeps Valuation Questions In Focus
Pan Pacific International Holdings (TSE:7532) has given investors fresh data to consider, with September 2026 sales figures showing year-over-year gains across domestic retail, discount stores, and the UNY supermarket business.
The September sales update lands against a mixed share price backdrop, with Pan Pacific International Holdings’ 1 month share price return of 5.17% and 7 day gain of 1.33% partly offsetting a 90 day share price decline of 18.94% and a 1 year total shareholder return that is down 21.42%. However, the 3 year and 5 year total shareholder returns of 35.68% and 59.19% still point to a much stronger longer run record.
Scan how Pan Pacific International Holdings compares with other retailers showing solid sales momentum by reviewing our hand picked 72 high quality undiscovered gems in the sector.
Pan Pacific International Holdings has bounced in the short term while longer horizon returns still show a clear drawdown. The key issue now is whether the recent lift has already used up most of the upside or not.
Preferred P/E of 20.3x for Pan Pacific International Holdings: Is it justified?
On current figures, Pan Pacific International Holdings trades on a P/E of 20.3x. This prices the latest close of ¥748.8 at a richer level than much of the multiline retail sector in Japan and still leaves the shares below the consensus analyst target of ¥1,011.34.
The P/E ratio compares what investors are willing to pay for each unit of earnings. For a retailer like Pan Pacific International Holdings, it reflects how the market is weighing its earnings track record, exposed to both domestic chains and overseas formats, against the risks of slower forecast growth.
Pan Pacific International Holdings is flagged as expensive versus the JP Multiline Retail industry average P/E of 16.6x. It also sits slightly above the estimated fair P/E of 20.2x that our model suggests the market could move toward over time.
Explore the SWS fair ratio for Pan Pacific International Holdings.
Result: Price-to-Earnings of 20.3x (OVERVALUED)
Still, the Pan Pacific International Holdings story could be knocked off course if domestic consumer demand cools or overseas formats struggle to maintain shopper traffic.
Find out about the key risks to this Pan Pacific International Holdings narrative.
Another view on Pan Pacific International Holdings’ value
The P/E story paints Pan Pacific International Holdings as slightly expensive, yet the SWS DCF model points the other way. On those cash flow assumptions, the estimated value sits at ¥536.77, which makes the current ¥748.8 level look overvalued. Which lens do you trust more when the signals clash?
Look into how the SWS DCF model arrives at its fair value.
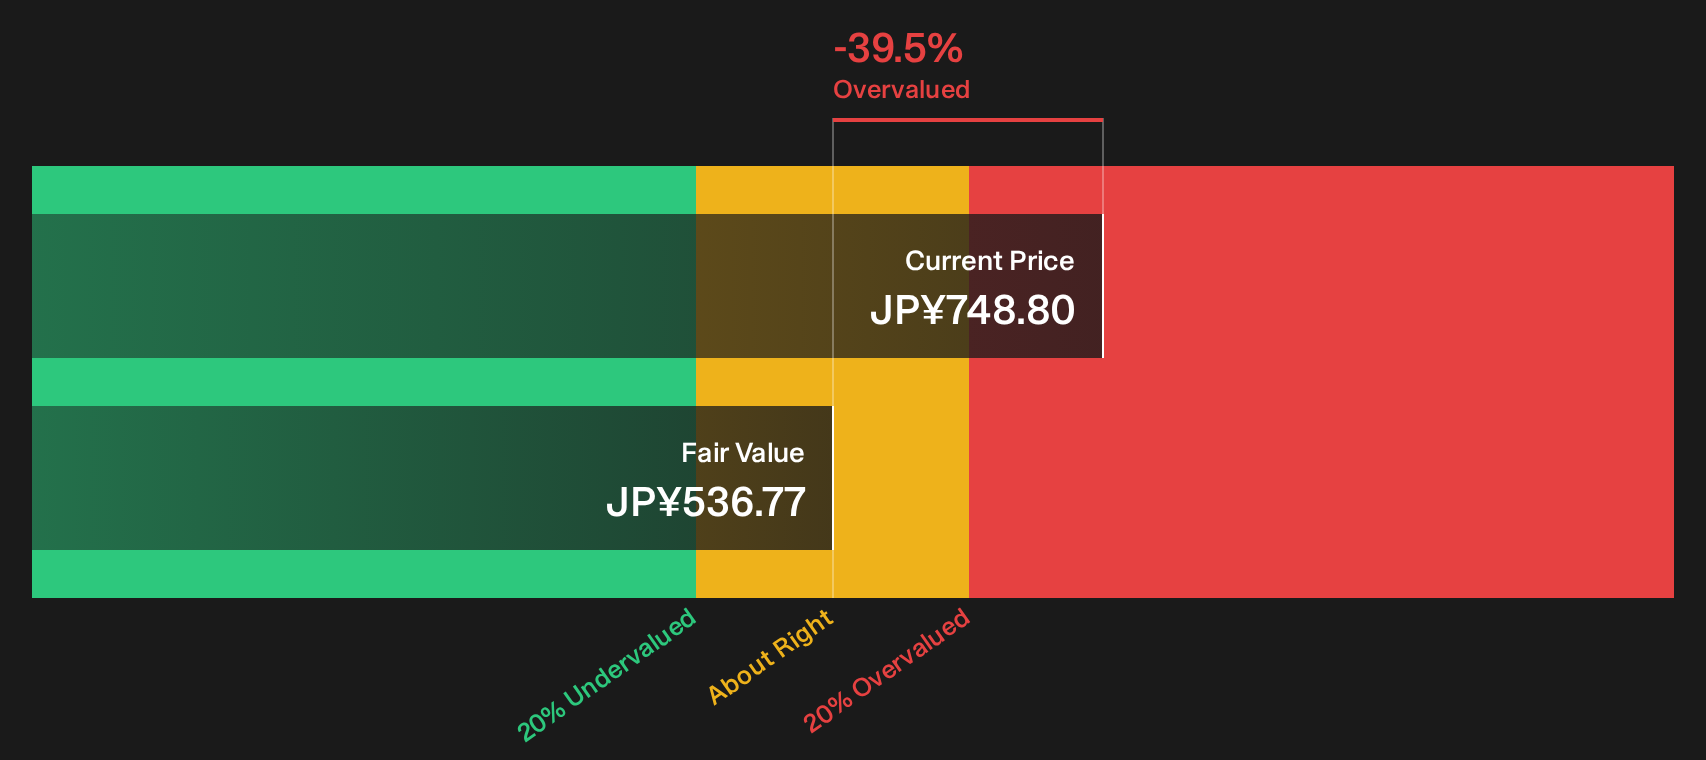
Simply Wall St performs a discounted cash flow (DCF) on every stock in the world every day (check out Pan Pacific International Holdings for example). We show the entire calculation in full. You can track the result in your watchlist or portfolio and be alerted when this changes, or use our stock screener to discover 14 high quality undervalued stocks. If you save a screener we even alert you when new companies match - so you never miss a potential opportunity.
Next Steps
Feeling unsure which way the Pan Pacific International Holdings story leans after all that conflicting valuation data and share price context? Act while the information is fresh. Review the underlying metrics for yourself, then pressure test any optimism by weighing the 3 key rewards
Looking for more investment ideas beyond Pan Pacific International Holdings?
Do not stop your research with Pan Pacific International Holdings. Use this momentum to build a stronger watchlist and widen your pool of potential opportunities.
- Explore reliable compounding potential by reviewing companies with resilient cash generation and appealing valuations through the 14 high quality undervalued stocks.
- Strengthen your defense by filtering for businesses with robust finances and low leverage using the list of solid balance sheet and fundamentals (23 results).
- Support your income focus by scanning for established payers offering sizeable yields and consistent distributions through the 30 dividend fortresses.
Have feedback on this article? Concerned about the content? Get in touch with us directly. Alternatively, email editorial-team@simplywallst.com