


EN
Why Edison International (EIX) Is Drawing Fresh Attention
Anticipation around Edison International (EIX) is building as investors look ahead to the upcoming Q3 2026 earnings release, with expectations framed by softer consensus forecasts and a recent pattern of EPS outperformance.
The current US$57.35 share price comes after a sharp 27.07% decline in the 3 month share price return, followed by a 30 day share price rebound of 8.93%, while longer term total shareholder returns of 4.78% over 1 year and 15.97% over 5 years point to steadier compounding in the background.
Compare Edison International’s earnings story with other grid and infrastructure plays by scanning our curated list of 42 power grid technology and infrastructure stocks to identify potential candidates that face similar catalysts and risks.
The recent swing in Edison International’s share price could reflect investors reassessing wildfire and grid risks as much as any change in the utility’s earnings power. How does that mix of sentiment and fundamentals show up in today’s valuation?
Most Popular Narrative: 10.3% Undervalued
The most followed narrative pegs Edison International’s fair value at $63.93, above the last close of $57.35. As a result, the market price is sitting below that framework while wildfire and policy risks dominate the discussion.
Policy driven increases in electrification, together with climate goals, continue to require large scale grid upgrades in Southern California that Edison International plans to address through a US$38b to US$41b capital program from 2026 to 2030. This program is expected to increase the regulated rate base and support future revenue and earnings.
See why 37 investors see Edison International as 10% undervalued.
Result: Fair Value of $63.93 (UNDERVALUED)
Still, wildfire liability and California policy decisions, including the Wildfire Fund framework and Eaton Fire related claims, could quickly challenge that 10.3% undervalued story.
Find out about the key risks to this Edison International narrative.
Another View On Edison International’s Valuation
The first narrative leans on analyst targets that frame Edison International as about 10.3% undervalued at $63.93. A second lens uses our DCF model, which puts future cash flow value closer to $55.27. At $57.35, that implies the stock is trading above this estimate. Which yardstick do you trust more when the cash flow picture and analyst expectations point in different directions?
Look into how the SWS DCF model arrives at its fair value.
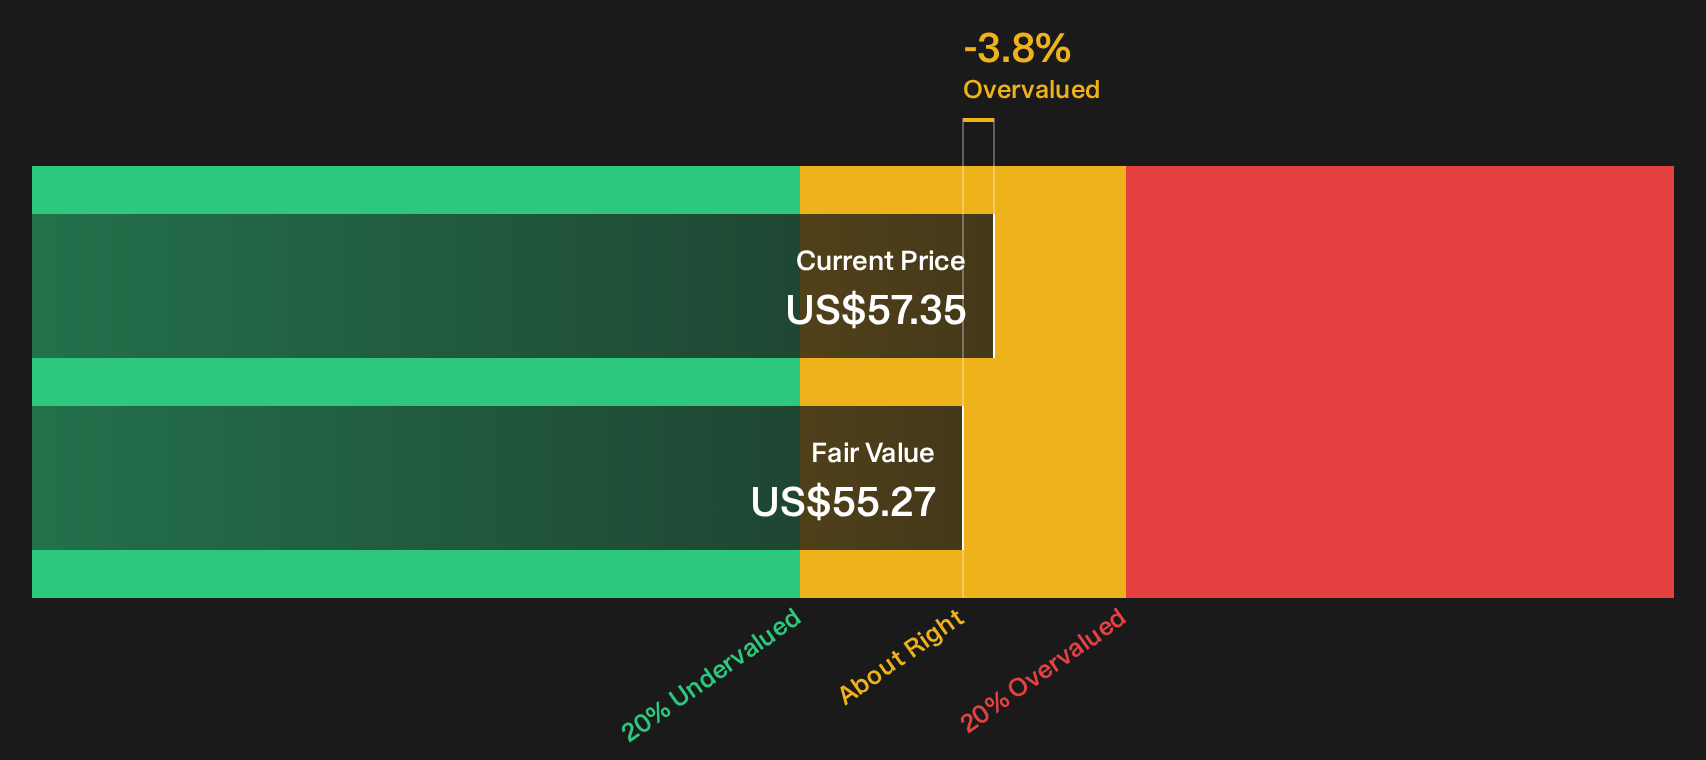
Simply Wall St performs a discounted cash flow (DCF) on every stock in the world every day (check out Edison International for example). We show the entire calculation in full. You can track the result in your watchlist or portfolio and be alerted when this changes, or use our stock screener to discover 29 high quality undervalued stocks. If you save a screener we even alert you when new companies match - so you never miss a potential opportunity.
Next Steps
Mixed messages on Edison International’s outlook can feel confusing, so do not sit on the fence and let others frame the narrative for you. Instead, weigh the upside and the downside in the data directly by starting with 3 key rewards and 3 important warning signs
Looking for more investment ideas beyond Edison International?
Do not stop your research with Edison International. Broaden your watchlist with other clearly defined setups that match your risk tolerance and return goals.
- Spot potential upside early by scanning a 21 high quality undiscovered gems that filters for companies with strong fundamentals that many investors may not be watching yet.
- Prioritise resilience in tougher markets by reviewing a 30 resilient stocks with low risk scores that highlights businesses with lower risk scores based on key financial checks.
- Focus on balance sheet strength by using a list of solid balance sheet and fundamentals (24 results) that surfaces companies with healthier financial foundations to support their operations.
Have feedback on this article? Concerned about the content? Get in touch with us directly. Alternatively, email editorial-team@simplywallst.com