


EN
ASX Penny Stocks Spotlight Harvey Norman Holdings And Two Others
The Australian market is facing a challenging start, with ASX 200 futures pointing to a weaker opening amid concerns over rising oil prices and inflation pressures. Amid these broader economic conditions, investors are closely watching sector performance, particularly the divide between financials and resources. Penny stocks may be considered an outdated term, but they still represent intriguing opportunities for growth in smaller or newer companies. By focusing on those with strong financial health, investors can uncover hidden gems that might offer significant returns despite current market uncertainties.
Let's take a closer look at a couple of our picks from the screened companies.
Harvey Norman Holdings (ASX:HVN)
Simply Wall St Financial Health Rating: ★★★★☆☆
Overview: Harvey Norman Holdings Limited operates in the integrated retail, franchise, property, and digital system sectors with a market capitalization of A$5.20 billion.
Operations: The company generates revenue from various segments, including Retail in Ireland (A$776.94 million), New Zealand (A$951.94 million), the United Kingdom (A$52.25 million), Slovenia & Croatia (A$259.89 million), Singapore & Malaysia (A$787.24 million), and Non-Franchised Retail operations (A$231.55 million).
Market Cap: A$5.2B
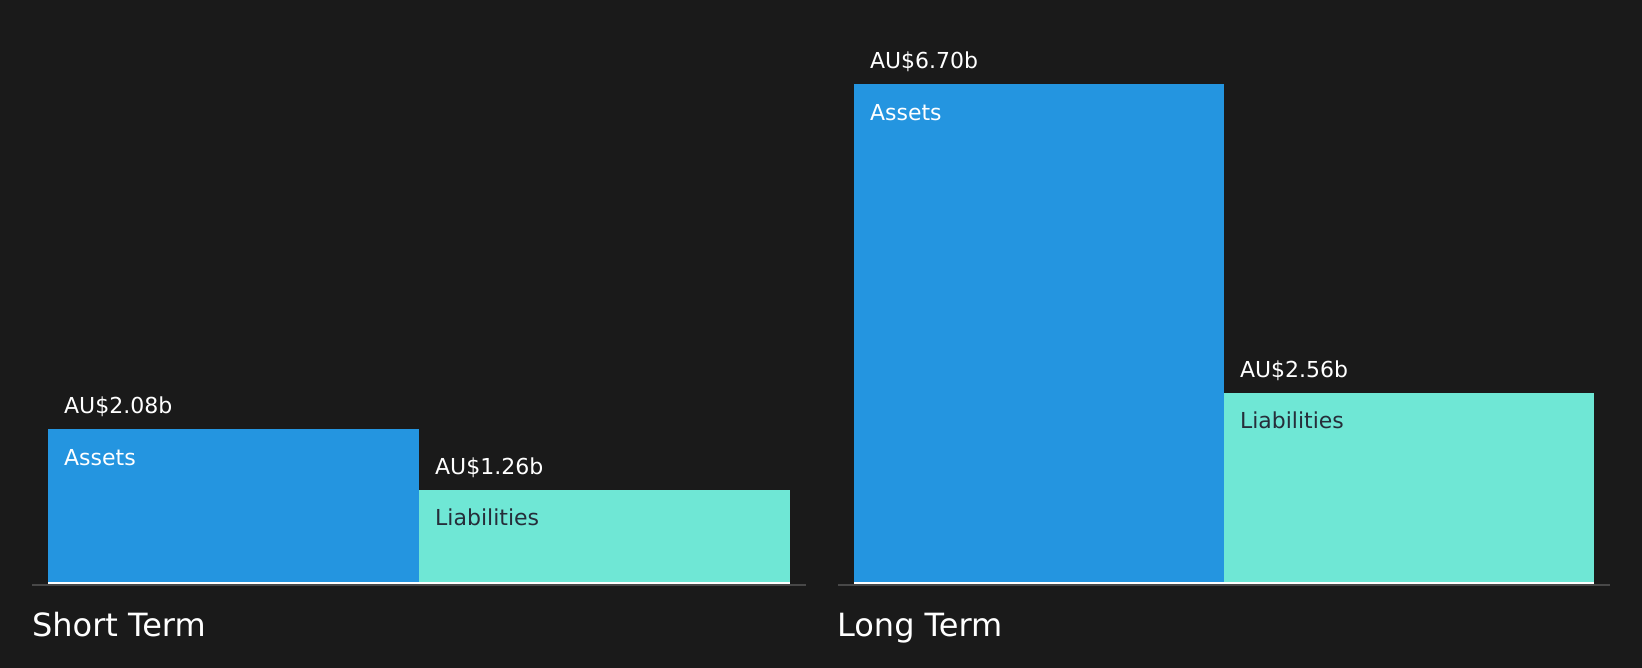
Harvey Norman Holdings, with a market capitalization of A$5.20 billion, presents a mixed investment case. While its short-term assets (A$2.1 billion) exceed short-term liabilities (A$1.3 billion), long-term liabilities are not fully covered by these assets. The company's earnings have shown modest growth recently but declined over the past five years and are forecast to decline slightly in the near term. Despite stable weekly volatility and satisfactory debt levels, Harvey Norman faces challenges such as a declining net profit margin and an unstable dividend track record, compounded by recent legal issues resulting in significant penalties.
- Take a closer look at Harvey Norman Holdings' potential here in our financial health report.
- Explore Harvey Norman Holdings' analyst forecasts in our growth report.
Mach7 Technologies (ASX:M7T)
Simply Wall St Financial Health Rating: ★★★★★★
Overview: Mach7 Technologies Limited develops and commercializes medical imaging and data management software solutions for healthcare organizations worldwide, with a market cap of A$56.40 million.
Operations: The company's revenue is derived from Software Licenses (A$13.26 million), Professional Services (A$3.04 million), and Maintenance and Support (A$11.61 million).
Market Cap: A$56.4M
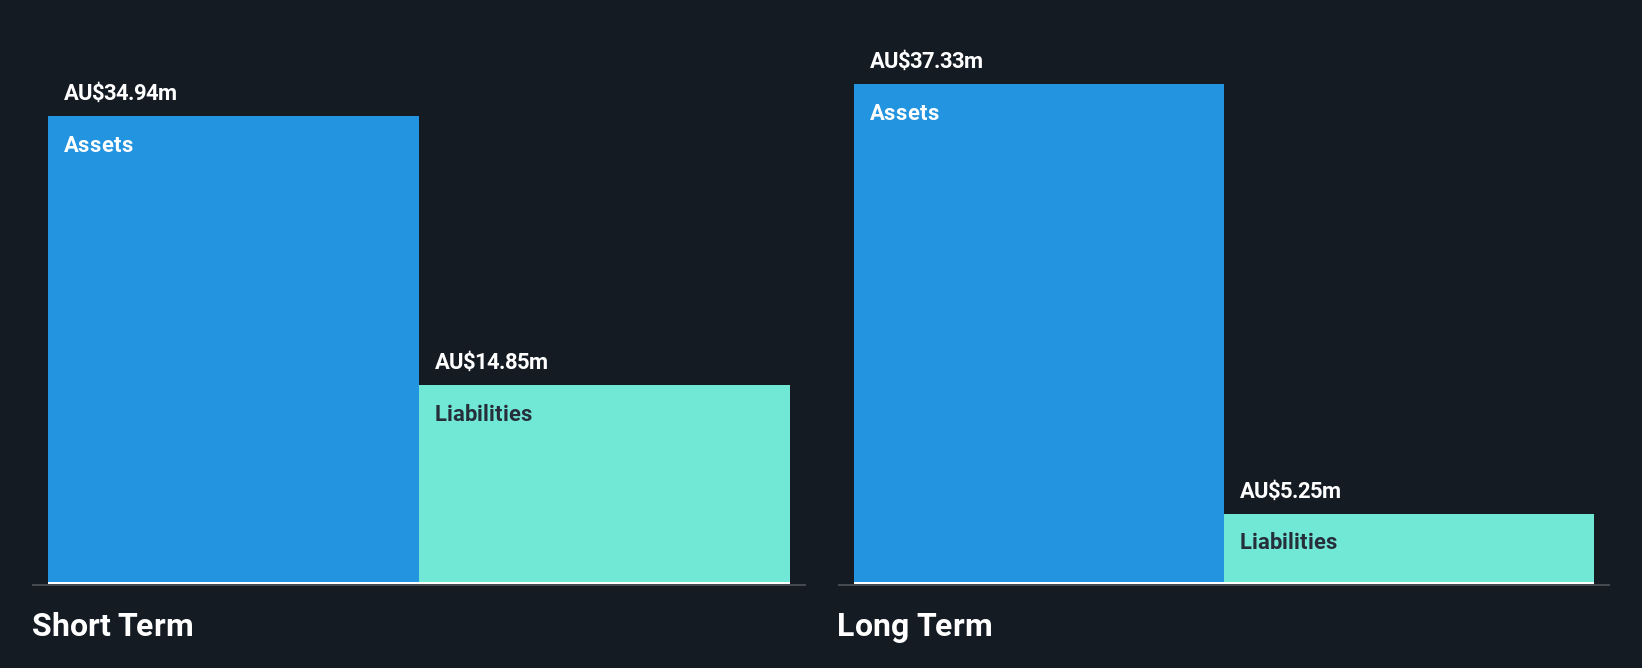
Mach7 Technologies, with a market cap of A$56.40 million, operates in the healthcare software sector and remains unprofitable with increasing losses over the past five years. Despite this, it maintains a strong cash runway exceeding three years and is debt-free. The company reported a net loss of A$8.93 million for the full year ending June 2026, against sales of A$27.91 million—a decrease from the previous year’s revenue. Recent executive changes include appointing Shawni Hadfield as CFO, who brings experience in scaling SaaS businesses and improving profitability—key factors for potential future growth amid current challenges.
- Click here and access our complete financial health analysis report to understand the dynamics of Mach7 Technologies.
- Gain insights into Mach7 Technologies' outlook and expected performance with our report on the company's earnings estimates.
Omni Bridgeway (ASX:OBL)
Simply Wall St Financial Health Rating: ★★★★☆☆
Overview: Omni Bridgeway Limited, along with its subsidiaries, offers dispute and litigation finance services across multiple regions including Australia, the United States, Canada, Latin America, Asia, New Zealand, Europe, the Middle East and Africa with a market cap of A$448.95 million.
Operations: The company generates revenue of A$112.26 million from funding and providing services related to legal dispute resolution.
Market Cap: A$448.95M
Omni Bridgeway, with a market cap of A$448.95 million, has seen fluctuating financial performance recently. Its revenue for the year ended June 2026 was A$182.24 million, down from A$651.45 million the previous year, while net income also declined significantly to A$53.7 million from A$349.8 million. The company's interest coverage is weak at 2.3 times EBIT, and its operating cash flow remains negative despite having more cash than debt and reducing its debt-to-equity ratio over five years to 4.1%. Trading at a price-to-earnings ratio of 8.4x suggests it may be undervalued compared to peers in the diversified financial sector.
- Click to explore a detailed breakdown of our findings in Omni Bridgeway's financial health report.
- Evaluate Omni Bridgeway's prospects by accessing our earnings growth report.

Summing It All Up
- Click this link to deep-dive into the 423 companies within our ASX Penny Stocks screener.
- Ready For A Different Approach? We've found 8 US stocks that are forecast to pay a dividend yeild of over 6% next year. See the full list for free.
This article by Simply Wall St is general in nature. We provide commentary based on historical data and analyst forecasts only using an unbiased methodology and our articles are not intended to be financial advice. It does not constitute a recommendation to buy or sell any stock, and does not take account of your objectives, or your financial situation. We aim to bring you long-term focused analysis driven by fundamental data. Note that our analysis may not factor in the latest price-sensitive company announcements or qualitative material. Simply Wall St has no position in any stocks mentioned.
Have feedback on this article? Concerned about the content? Get in touch with us directly. Alternatively, email editorial-team@simplywallst.com