


EN
Hulic (TSE:3003) Could Be 29% Below Fair Value On San Jose Deal
Hulic (TSE:3003) has joined Kennedy Wilson and Fuyo General Lease (USA) Inc. in a three-party venture to buy the One South Market multifamily complex in downtown San Jose for US$176 million.
Hulic’s involvement in this San Jose acquisition comes at a time when momentum in the stock has been building, with a 7 day share price return of 4.17% and a 1 year total shareholder return of 17.10% from a share price of ¥1,773.5.
Scan for other real estate players expanding into tight housing markets by reviewing the curated list of solid balance sheet and fundamentals (23 results) that echo Hulic's blend of scale, diversification, and financial resilience.
Hulic is now tying fresh US$ capital to San Jose real estate while its shares already reflect strong recent returns. Does the current price still leave enough value on the table, or is patience the better move?
Price-to-Earnings of 11.3x: Is it justified?
Hulic trades on a P/E of 11.3x, which sits below the broader JP market while the stock has already delivered solid multi year returns from a last close of ¥1,773.5.
The P/E ratio compares the current share price with earnings per share, so it tells you how much investors are paying for each unit of profit. For a real estate focused group like Hulic, this frame is often used as a quick check on whether current earnings expectations look stretched or conservative.
The business shows a mixed picture. On one hand, earnings grew 15.8% over the past year and have risen 10.7% per year over five years, with high quality earnings and profit growth that recently outpaced the JP Real Estate industry. On the other hand, Return on Equity sits at 12.3%, net profit margins dipped from 15% to 14.1%, and analysts expect revenue and earnings growth to run slower than the wider JP market over the coming years, which may limit how far the valuation multiple can shift.
Compared with the JP Real Estate industry average P/E of 9.9x, Hulic trades on a richer multiple, which suggests investors are willing to pay more than for a typical sector peer. Yet against the estimated fair P/E of 16x, the current 11.3x looks materially lower, which indicates there could be room for the valuation to move closer to that fair ratio if earnings quality and growth trends remain intact.
Explore the SWS fair ratio for Hulic.
Result: Price-to-Earnings of 11.3x (UNDERVALUED)
Still, the Hulic story can change quickly if San Jose assets underperform expectations or if revenue growth of 4.7% and net income growth of 5.5% slow meaningfully.
Find out about the key risks to this Hulic narrative.
Another View on Hulic's valuation
A different lens paints a sharper contrast. The SWS DCF model estimates Hulic’s future cash flow value at ¥179 per share, far below the current ¥1,773.5 level, which points to the stock looking overvalued rather than cheap on this measure.
That kind of gap suggests real valuation risk if cash flows end up closer to the DCF path than recent earnings trends. It raises a simple question for you as a shareholder: Which signal carries more weight, today’s earnings multiple or the long term cash flow picture?
Look into how the SWS DCF model arrives at its fair value.
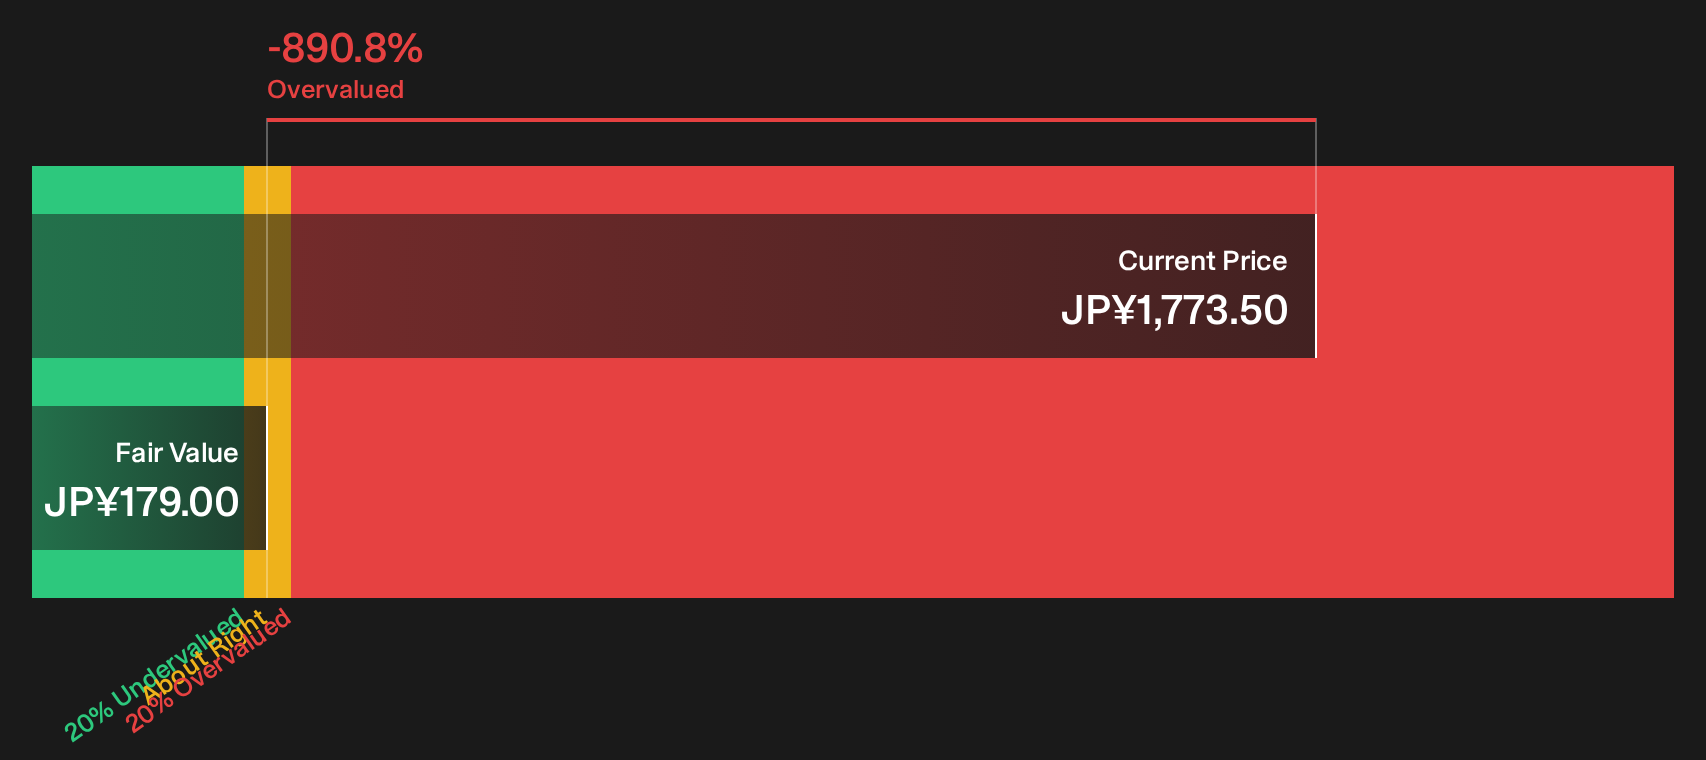
Simply Wall St performs a discounted cash flow (DCF) on every stock in the world every day (check out Hulic for example). We show the entire calculation in full. You can track the result in your watchlist or portfolio and be alerted when this changes, or use our stock screener to discover 14 high quality undervalued stocks. If you save a screener we even alert you when new companies match - so you never miss a potential opportunity.
Next Steps
If this Hulic story feels finely balanced between promise and risk, move quickly, review the numbers yourself, and weigh the 3 key rewards and 2 important warning signs.
Looking for more Hulic sized investment ideas?
Do not stop with Hulic. Broaden your watchlist now and give yourself more ways to put your capital to work with focused stock ideas that match your style.
- Target growth at a discount by scanning the 72 high quality undiscovered gems that filters for companies with strong fundamentals the market may not be watching yet.
- Prioritise staying power by reviewing the 22 resilient stocks with low risk scores that highlights resilient businesses with lower overall risk scores.
- Stack potential income by checking the 29 dividend fortresses that surfaces companies offering yields of 5% or more.
Have feedback on this article? Concerned about the content? Get in touch with us directly. Alternatively, email editorial-team@simplywallst.com