


EN
Gimv (ENXTBR:GIMB) And The Undervalued Case Following Its Three Year Run
Gimv (ENXTBR:GIMB) is back in focus after a 53.7% total return over the past three years, alongside fresh interest in how its capital recycling and intrinsic value estimates compare with today’s share price.
Recent trading backs up that optimism. The share price is now at €49.0, with a 90-day share price return of 9.99% and an 11.24% year-to-date share price gain. The 3-year total shareholder return of 53.74% signals momentum that has built over several years rather than just a short burst of enthusiasm.
Scan other potential underpriced opportunities with our curated list of 193 high quality undervalued stocks, which, like Gimv, may be trading below their estimated intrinsic value.
Gimv’s rebound has already rewarded holders, yet the estimated intrinsic value still sits well above the €49.0 share price. Does it make sense to add exposure now, or wait for a cheaper entry point?
Price-to-Earnings of 6.1x: Is it justified?
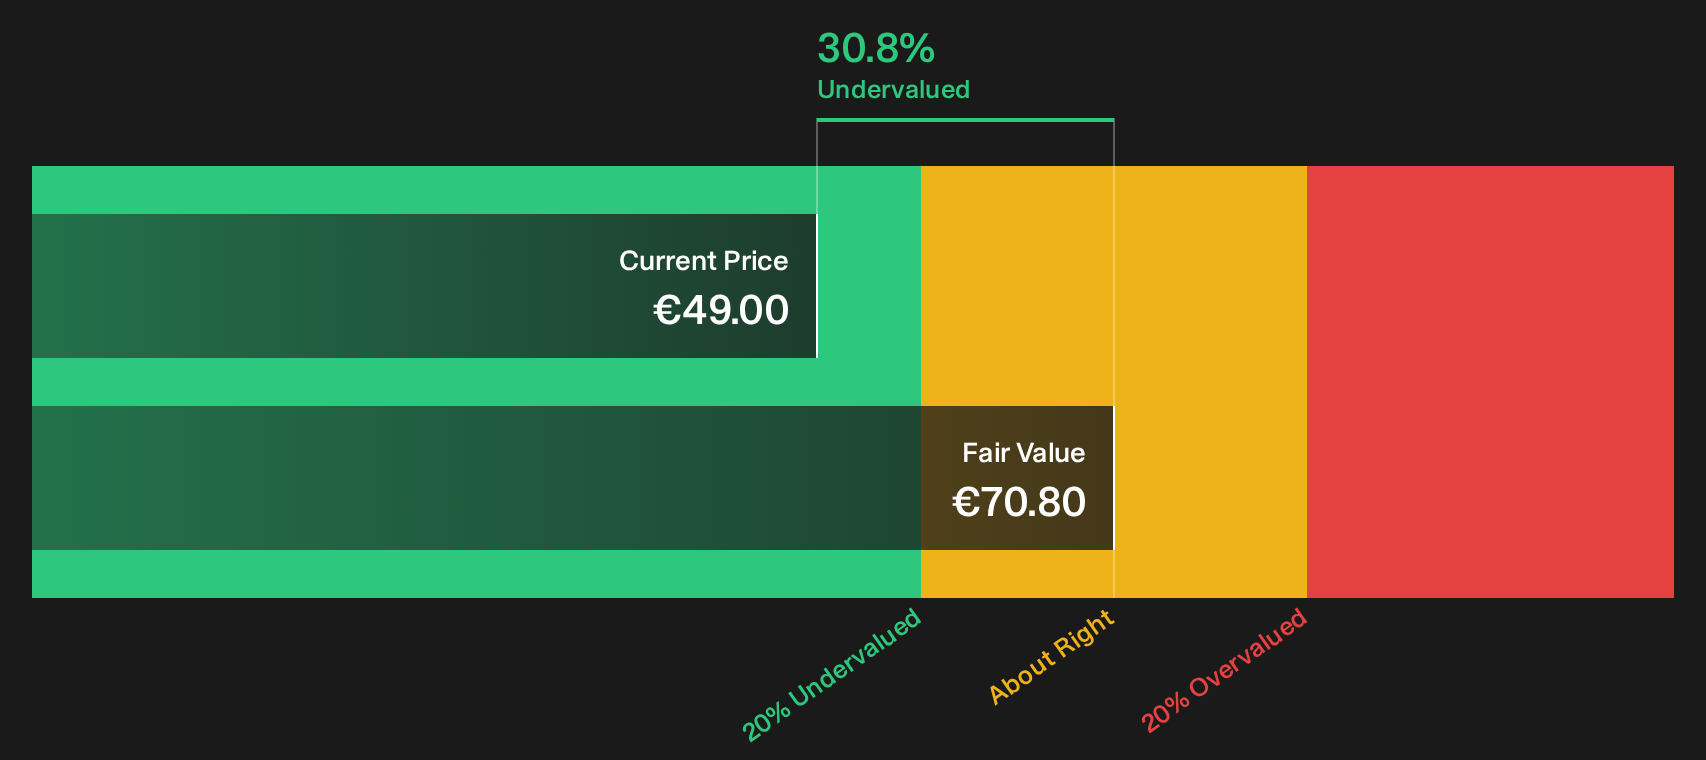
On simple earnings terms, Gimv looks inexpensive. The stock trades on a P/E of 6.1x compared with a peer average of 37x and a European Capital Markets industry average of 12.8x, while the SWS DCF model points to an estimated future cash flow value of €70.8 per share versus the current €49.0 price.
P/E compares what investors pay today with the profits the business currently generates. For an investment group like Gimv, which reports both cash and non-cash earnings, this measure gives a quick sense of how much of those profits are already reflected in the share price.
Earnings growth has been strong, with profits reported to have grown 15.8% per year over the past 5 years and 39.8% in the last year, yet the P/E of 6.1x is well below both the 37x peer average and the 12.8x industry level. That gap suggests the market is pricing Gimv’s earnings more conservatively than its sector and direct peers.
Result: Price-to-Earnings of 6.1x
See what the numbers say about this price — find out in our valuation breakdown..
Still, the Gimv story can change quickly if capital markets slow deal activity or if portfolio exits come in below the current intrinsic value assumptions.
Find out about the key risks to this Gimv narrative.
Another View on Gimv’s Value
The low P/E puts Gimv in a cheap bucket. The SWS DCF model points to something similar, with an estimated future cash flow value of €70.8 per share versus the €49.0 market price. If both signals line up as undervalued, what could still go differently from here?
Look into how the SWS DCF model arrives at its fair value.
Simply Wall St performs a discounted cash flow (DCF) on every stock in the world every day (check out Gimv for example). We show the entire calculation in full. You can track the result in your watchlist or portfolio and be alerted when this changes, or use our stock screener to discover 193 high quality undervalued stocks. If you save a screener we even alert you when new companies match - so you never miss a potential opportunity.
Next Steps
Mixed signals are hard to ignore, with Gimv showing both appealing rewards and clear risks that deserve your own scrutiny. Act while the data is fresh and compare the optimistic and cautious signals side by side with the 2 key rewards and 2 important warning signs.
Looking for more investment ideas beyond Gimv?
If you stop with Gimv, you risk missing other opportunities that fit your style just as well, maybe even better, across quality, income, and resilience.
- Target potential mispricing early by scanning a focused shortlist of companies that look underappreciated on fundamentals with the 193 high quality undervalued stocks.
- Lock in stronger income potential by reviewing stocks that combine higher yields with robustness using the 225 dividend fortresses.
- Prioritise staying power by filtering for businesses that carry sturdier finances through the list of solid balance sheet and fundamentals (205 results).
Have feedback on this article? Concerned about the content? Get in touch with us directly. Alternatively, email editorial-team@simplywallst.com