


EN
OEM International (OM:OEM B) Could Be 7% Below Fair Value As Earnings Growth Lifts Interest
Why OEM International’s latest earnings and board changes matter for investors
OEM International (OM:OEM B) has given investors fresh information to work with after its October earnings release, followed by a board reshuffle that included appointing Patrik Andersson as Chairperson.
Recent figures have stirred interest in OEM International again. The 1-day share price return of 1.69% comes after a 7-day share price decline of 4.74% and a 30-day drop of 6.84%, while the year-to-date share price return of 22.50% sits alongside a 3-year total shareholder return of 157.05%, indicating that long term momentum appears strong even as short term enthusiasm has cooled.
Scan beyond OEM International and see how it compares with a hand picked 193 high quality undervalued stocks featuring strong cash flows and balance sheets that may support more resilient performance through mixed sentiment.
OEM International now trades at a discount to both analyst targets and one valuation estimate after a brief pullback. Is that caution a sensible read on risk, or a misprice on recent earnings strength?
Price-to-earnings of 33.1x: Is it justified?
OEM International’s recent pullback still leaves the stock trading on a P/E of 33.1x, which is rich next to peers even though the SWS DCF model points to a fair value of SEK181.27 versus the last close at SEK168.8.
The P/E ratio compares the current share price with per share earnings. For a distributor of industrial automation components like OEM International, this metric effectively shows how much investors are paying today for each unit of current profit.
Forecasts suggest earnings growth of 10.06% per year and revenue growth of 11.4% per year, supported by high quality earnings and a Return on Equity of 22.1%. That points to a business generating solid profitability. Yet the P/E of 33.1x sits well above both the European Trade Distributors industry average of 16.3x and the estimated fair P/E of 21.2x, which signals the current valuation embeds a much richer expectation than the level the market could move towards based on that fair ratio.
Explore the SWS fair ratio for OEM International.
Result: Price-to-earnings of 33.1x (OVERVALUED).
Still, OEM International faces clear risks if industrial demand softens or if the current 33.1x P/E compresses faster than earnings and cash generation can support.
Find out about the key risks to this OEM International narrative.
Another view on OEM International’s value
The rich 33.1x P/E makes OEM International look stretched, yet our DCF model tells a different story. On that measure, the shares trade around SEK168.8 against an estimated future cash flow value of SEK181.27, suggesting a modest undervaluation that leaves investors asking which lens deserves more weight.
Look into how the SWS DCF model arrives at its fair value.
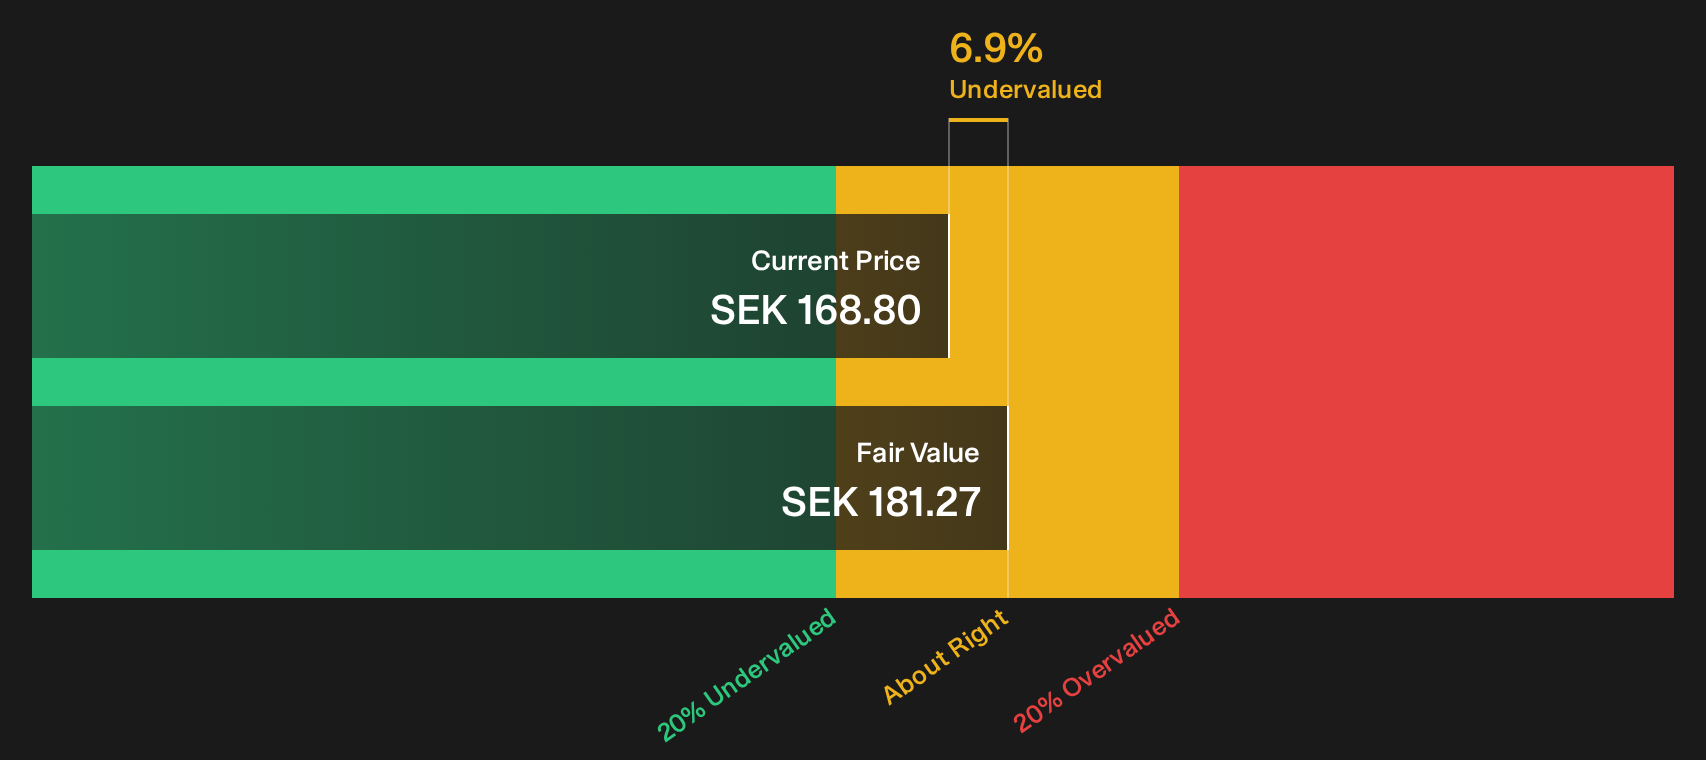
Simply Wall St performs a discounted cash flow (DCF) on every stock in the world every day (check out OEM International for example). We show the entire calculation in full. You can track the result in your watchlist or portfolio and be alerted when this changes, or use our stock screener to discover 193 high quality undervalued stocks. If you save a screener we even alert you when new companies match - so you never miss a potential opportunity.
Next Steps
Mixed messages on OEM International’s valuation and earnings story invite a closer look, so move quickly and stress test the numbers yourself. To see what optimistic investors are focusing on, review the 3 key rewards.
Looking for more OEM International investment ideas?
If OEM International has sharpened your focus, do not stop here. Broaden your watchlist with fresh, data driven ideas sourced directly from Simply Wall Street screeners.
- Spot potential mispricing early by scanning a curated 193 high quality undervalued stocks that pair stronger cash flows with sturdier balance sheets than many investors currently track.
- Build a steadier income stream by reviewing a focused 225 dividend fortresses that highlights companies offering higher yields with supportive fundamentals.
- Reduce portfolio stress by zeroing in on a 221 resilient stocks with low risk scores that concentrates on businesses with more resilient risk profiles.
Have feedback on this article? Concerned about the content? Get in touch with us directly. Alternatively, email editorial-team@simplywallst.com