


EN
Obayashi (TSE:1802) Board Review Of NZ Solar Plan Puts Valuation In Focus
Obayashi (TSE:1802) has scheduled a board meeting on 22 October 2026 to review a potential investment in Lightyears’ solar power project in New Zealand, as well as the formation of a new company around it.
Obayashi’s interest in the New Zealand solar project lands at a moment when the share price has softened in recent months, with a 30 day share price return down 4.72% and a 90 day share price return down 11.16%. At the same time, total shareholder return over 1 year and 5 years, at 15.31% and 268.53% respectively, points to strong longer term momentum that this kind of renewable push could be seen as trying to extend.
Scan beyond Obayashi’s New Zealand solar move and size up peers riding similar themes with a hand picked set of 42 power grid technology and infrastructure stocks.
The New Zealand solar push could signal a deeper shift in how Obayashi earns its money, or it could just echo changing mood around the stock. To judge which story fits, the valuation now needs a closer look.
Price-to-Earnings of 10.3x: Is it justified for Obayashi?
On valuation, Obayashi appears modestly cheap rather than stretched, with the shares at ¥2,917.5 and multiple checks pointing to comparatively good value against both internal fair value estimates and peers.
The preferred yardstick here is the P/E ratio, which sits at 10.3x for Obayashi. The P/E ratio compares what investors are paying for each unit of current earnings and is a common reference point for construction and engineering groups where earnings visibility and order books matter as much as asset values.
Obayashi is described as trading at comparatively good value relative to peers and the broader construction industry, with its 10.3x P/E lining up with the JP Construction average of 10.3x. There is also an internal fair P/E estimate of 15.7x, and the current multiple is below that level. This indicates that the market is assigning a lower earnings multiple than the regression-based fair ratio suggests, which is a gap that could narrow or widen depending on how profits and sentiment change.
Relative to that fair P/E of 15.7x, the current 10.3x multiple is materially lower, which is comparative evidence that the stock is priced conservatively versus what those fair ratio checks imply.
Explore the SWS fair ratio for Obayashi.
Result: Price-to-Earnings of 10.3x (UNDERVALUED)
Still, weak recent share performance and flat net income growth could easily flip the story if the New Zealand solar project or construction demand disappoints.
Find out about the key risks to this Obayashi narrative.
Another View: Obayashi Through The Cash Flow Lens
Earnings multiples make Obayashi look conservatively priced, yet the SWS DCF model paints only a slight underpricing, with the shares at ¥2,917.5 versus an estimated future cash flow value of ¥2,953.88. That gap is narrow. Does it really leave much room for error if sentiment sours?
Look into how the SWS DCF model arrives at its fair value.
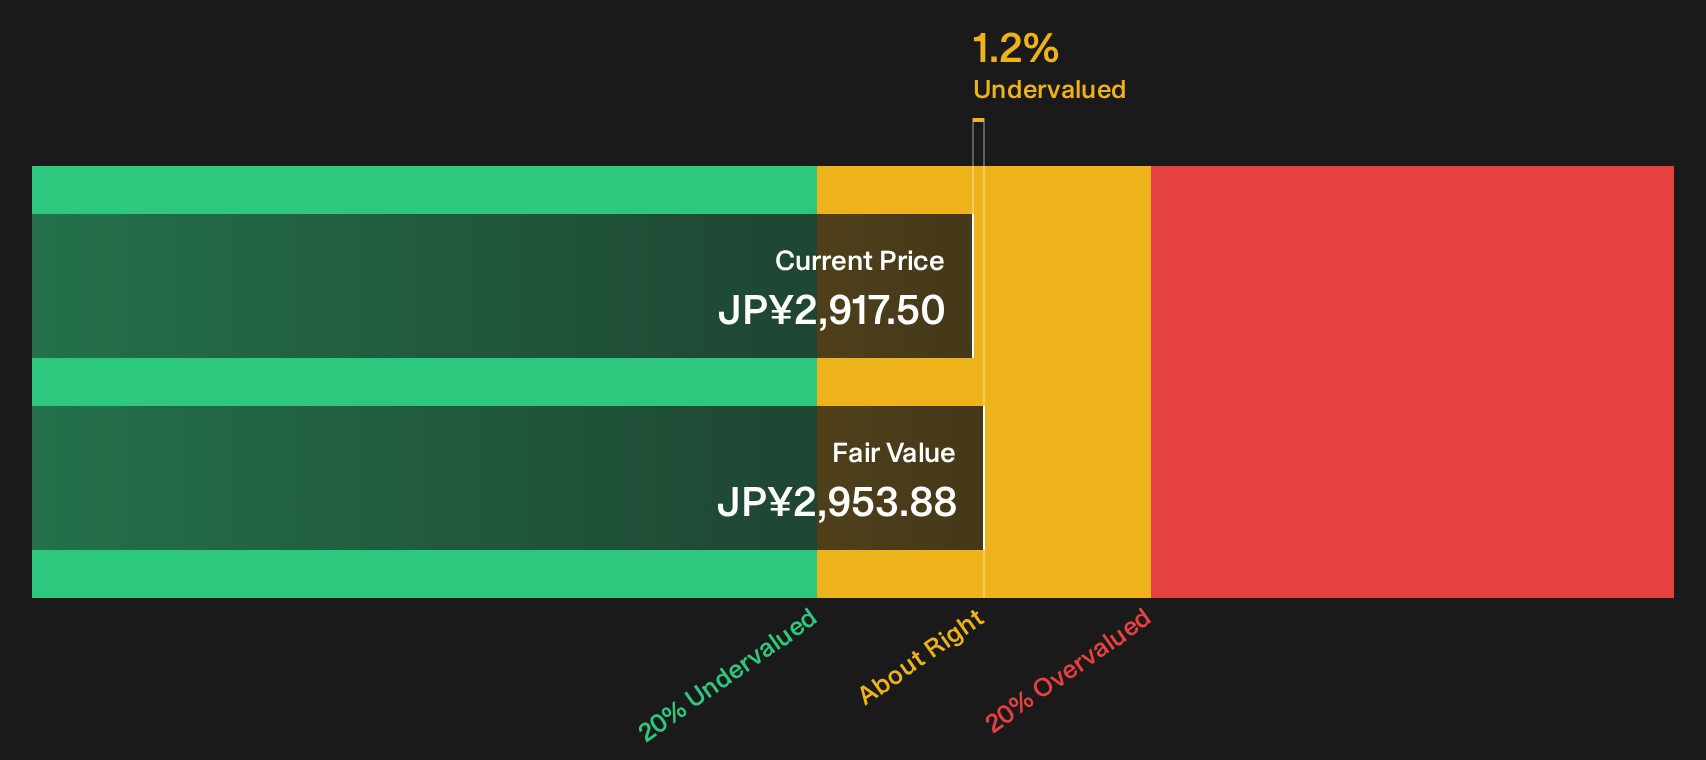
Simply Wall St performs a discounted cash flow (DCF) on every stock in the world every day (check out Obayashi for example). We show the entire calculation in full. You can track the result in your watchlist or portfolio and be alerted when this changes, or use our stock screener to discover 14 high quality undervalued stocks. If you save a screener we even alert you when new companies match - so you never miss a potential opportunity.
Next Steps
Mixed signals around Obayashi, between long term returns and recent share weakness, make this a moment to ask where you really stand. Use the full data set, weigh both the concerns and the bright spots, and then anchor your own view with 4 key rewards and 3 important warning signs
Looking for more investment ideas beyond Obayashi?
If Obayashi has your attention, do not stop there. Let the same disciplined lens guide you toward other opportunities that could sharpen your overall portfolio.
- Target potential mispricing by scanning a curated pool of companies that combine quality fundamentals with appealing valuations through the 14 high quality undervalued stocks.
- Strengthen your income stream by reviewing a focused set of high yield payers built to defend their payouts with the 29 dividend fortresses.
- Lower portfolio stress by filtering for financially resilient businesses that pair sturdy balance sheets with lower risk profiles using the 22 resilient stocks with low risk scores.
Have feedback on this article? Concerned about the content? Get in touch with us directly. Alternatively, email editorial-team@simplywallst.com