


EN
Is Huntington Bancshares (HBAN) Expensive Following Its Third Quarter Results And Buyback Backing?
Huntington Bancshares (HBAN) just put a lot on the table in one go. Third quarter earnings landed in line with expectations, revenue moved higher year over year, and management backed its dividend and buyback plans.
Despite the solid third quarter and fresh dividend affirmations, Huntington Bancshares’ share price has had a mixed run, with a 7 day share price return of 3.01% but a year to date share price decline of 10.01%. However, the 3 year total shareholder return of 88.49% points to much stronger longer term momentum.
Capitalize on Huntington Bancshares’ mix of income and price swings by reviewing a hand picked 5 dividend fortresses that are built around steady payouts and disciplined balance sheets.Huntington Bancshares has just delivered steady earnings, kept the dividend unchanged, and confirmed active buybacks. The share price has only inched higher. Does that set up a case for stepping in now, or for waiting for a cheaper shot?
Price-to-Earnings of 13.7x: Is it justified?
Valuation on Huntington Bancshares hinges on a P/E of 13.7x, which sits higher than peers even though the share price closed at $15.73. That gap raises questions about how much good news is already in the quote.
The P/E ratio compares the current share price to earnings per share and, for a bank like Huntington Bancshares, it is a shorthand for what investors are willing to pay for each dollar of profit. Because lenders are heavily tied to credit cycles and funding costs, this metric often reflects views on the durability of earnings rather than short term trading moves.
Huntington Bancshares is described as expensive against both the US Banks industry average P/E of 11.6x and a peer group average of 11.8x, which points to a clear valuation premium. At the same time, that 13.7x is below an estimated fair P/E of 16.5x, so there is a gap between where the market currently prices the stock and where the fair ratio implies it could move.
Explore the SWS fair ratio for Huntington Bancshares.
Result: Price-to-Earnings of 13.7x (ABOUT RIGHT)
Still, the case for Huntington Bancshares can weaken if credit quality deteriorates or if funding costs compress that P/E premium back toward the sector.
Find out about the key risks to this Huntington Bancshares narrative.
Another View on Huntington Bancshares’ Value
The earnings multiple paints one picture of Huntington Bancshares. Our DCF model offers a very different one. With the shares at $15.73 and the future cash flow value estimated at $31.18, the DCF view frames the stock as undervalued and highlights how important time horizon and patience can be for investors.
Look into how the SWS DCF model arrives at its fair value.
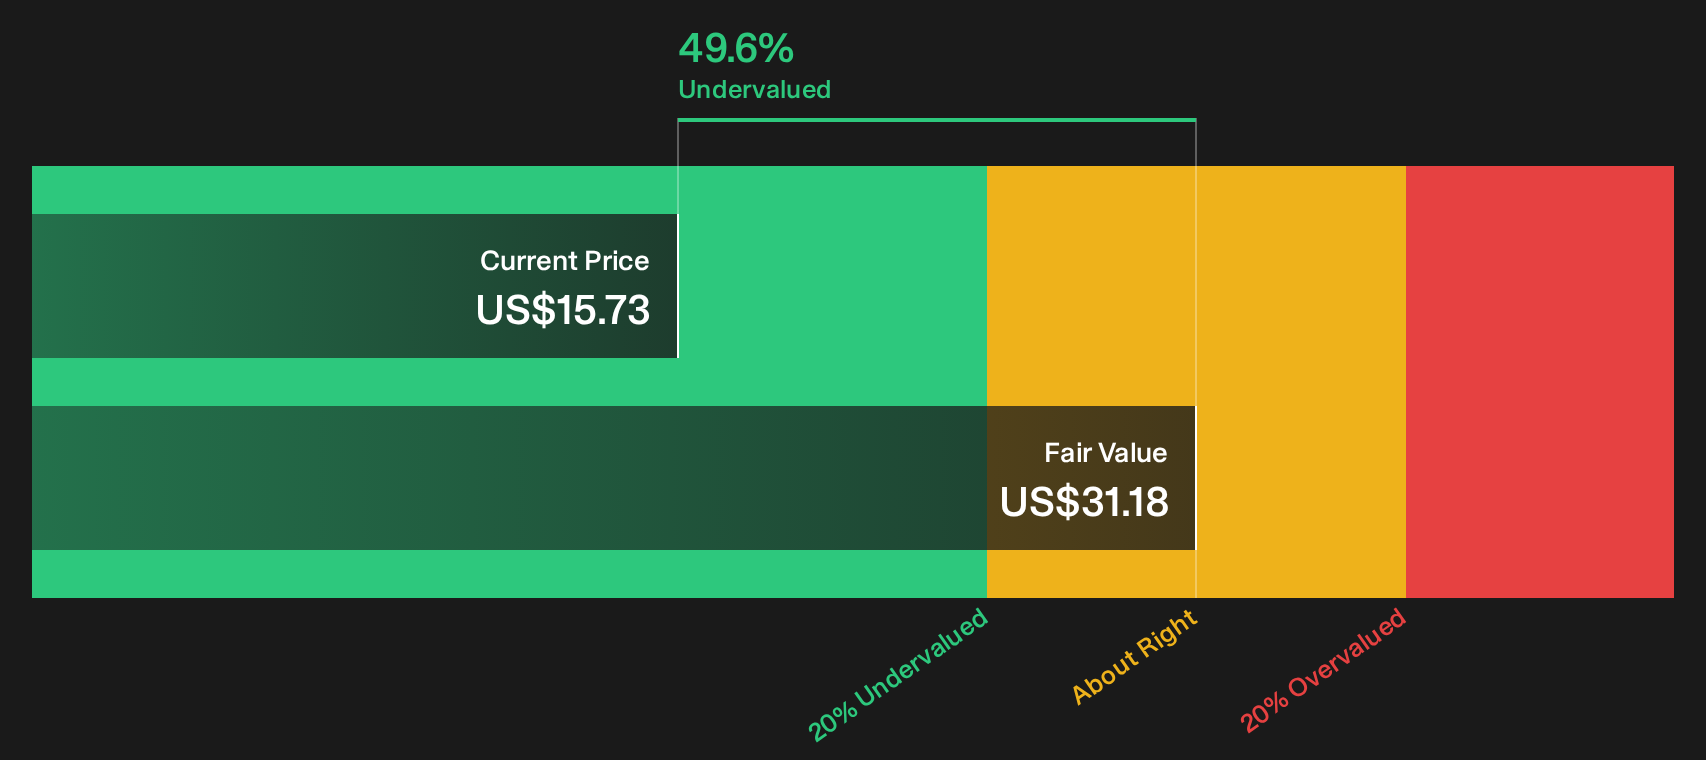
Simply Wall St performs a discounted cash flow (DCF) on every stock in the world every day (check out Huntington Bancshares for example). We show the entire calculation in full. You can track the result in your watchlist or portfolio and be alerted when this changes, or use our stock screener to discover 27 high quality undervalued stocks. If you save a screener we even alert you when new companies match - so you never miss a potential opportunity.
Next Steps
The combination of premium P/E, income, and long term returns around Huntington Bancshares can appear mixed. Accelerate your own research by weighing the 4 key rewards and 1 important warning sign
Looking for more Huntington Bancshares style ideas?
If Huntington Bancshares has your attention, do not stop here. Use the screener tools to find other stocks that match or improve on this risk reward mix.
- Target resilient cash generators that look mispriced today by scanning a curated set of 27 high quality undervalued stocks built around earnings strength and disciplined capital allocation.
- Prioritise staying power over drama by reviewing a focused group of 30 resilient stocks with low risk scores where balance sheets and risk scores both work in your favor.
- Hunt for tomorrow's potential leaders before the crowd arrives by tracking a shortlist of 21 high quality undiscovered gems with sturdy fundamentals and underfollowed stories.
Have feedback on this article? Concerned about the content? Get in touch with us directly. Alternatively, email editorial-team@simplywallst.com