


EN
Is Viscofan (BME:VIS) A Bargain After Third Quarter Earnings Beat?
Viscofan (BME:VIS) drew fresh attention on 22 October 2026 after reporting third quarter earnings, with sales of €335.68 million and net income of €40.44 million, both above the prior year’s figures.
The earnings release has arrived as Viscofan’s share price has been treading water, with a 30 day share price return that declined 1.27% and a 90 day move down 2.51%, even as the 1 year total shareholder return of 5.73% and 3 year total shareholder return of 18.28% point to steadier long run compounding.
Scan how Viscofan’s latest earnings compare with peers by reviewing our hand picked 191 high quality undervalued stocks that pair cash generation with balance sheet strength.
Viscofan is reporting higher sales and profit while the share price has barely moved over recent months. Does that combination still tilt the risk reward toward buyers at today’s level, once valuation is factored in?
Price-to-Earnings of 15.3x: Is it justified?
Viscofan trades on a P/E of 15.3x, very close to the peer average. This suggests the current €54.30 share price is broadly aligned with what the market is paying for similar food producers.
The P/E ratio links the market value of the stock to its earnings per share. It effectively shows how many euros investors are willing to pay today for each euro of Viscofan’s profit. For a mature, profitable business that already has a global footprint, this metric often becomes a quick shortcut for how the market rates the durability and quality of those earnings.
Analysts judge Viscofan to be good value relative to an estimated fair P/E of 17x. The current 15.3x multiple therefore sits at a discount to where that fair ratio suggests pricing could lean over time. At the same time, the stock is described as slightly expensive compared with the European Food sector P/E of 15.2x. This marginal gap implies investors are paying only a small premium versus the wider industry while still below the fair ratio level.
Explore the SWS fair ratio for Viscofan.
Result: Price-to-Earnings of 15.3x (ABOUT RIGHT)
Still, Viscofan’s thesis could be knocked off course if the single Wrapping segment faces weaker demand or if earnings growth stalls despite recent revenue and profit momentum.
Find out about the key risks to this Viscofan narrative.
Another view on Viscofan’s value
The SWS DCF model presents a very different view of Viscofan. On this measure, the €54.30 share price is far below an estimated future cash flow value of €265.36, which implies a very large potential gap between price and valuation. A difference of this size can indicate either an opportunity or significant model risk.
Look into how the SWS DCF model arrives at its fair value.
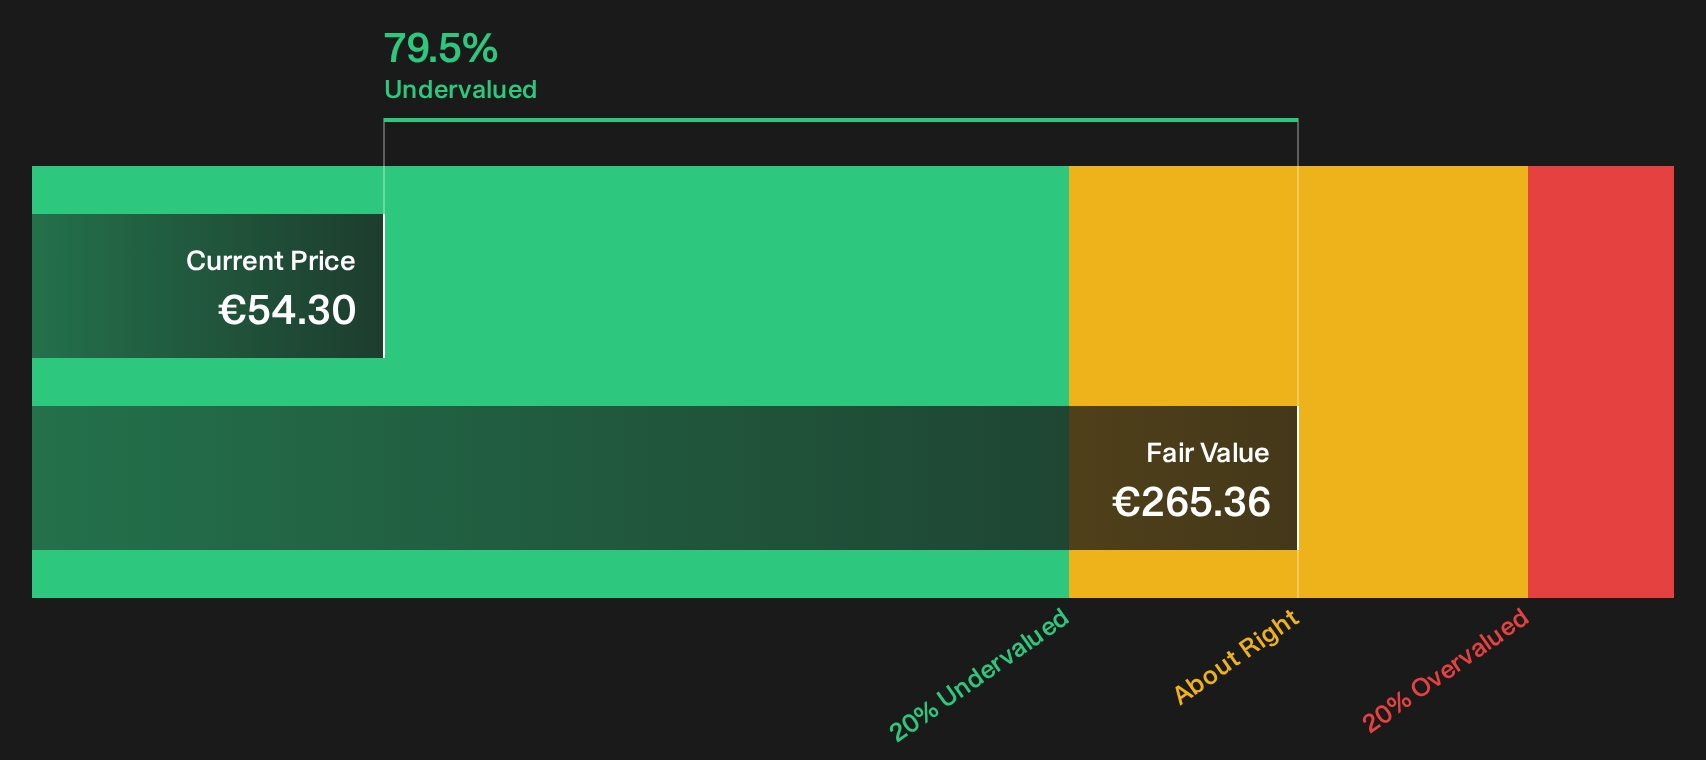
Simply Wall St performs a discounted cash flow (DCF) on every stock in the world every day (check out Viscofan for example). We show the entire calculation in full. You can track the result in your watchlist or portfolio and be alerted when this changes, or use our stock screener to discover 191 high quality undervalued stocks. If you save a screener we even alert you when new companies match - so you never miss a potential opportunity.
Next Steps
Mixed signals around Viscofan’s valuation and cash flow can pull sentiment in both directions, so move quickly, review the core metrics yourself and weigh the 4 key rewards and 1 important warning sign.
Looking for more Viscofan sized investment ideas?
If Viscofan has your attention, do not stop with a single opportunity. Cast the net wider now so you are not looking back at missed chances later.
- Target income first, then pick through potential high yield "fortresses" using the 225 dividend fortresses.
- Hunt for resilient balance sheets by scanning the list of solid balance sheet and fundamentals (203 results).
- Unearth potential future leaders before the crowd notices through the 619 high quality undiscovered gems.
Have feedback on this article? Concerned about the content? Get in touch with us directly. Alternatively, email editorial-team@simplywallst.com