
- PRICING
- LIVE QUOTES
- LEARN
- HELP


EN
How Strong Bookings At ICON (ICLR) Has Changed Its Investment Story
- ICON is heading into its late October 2026 earnings release with Wall Street expecting lower year over year earnings and revenue, despite recent upward tweaks to consensus EPS estimates.
- Strong bookings, a sizeable order backlog and DCF work pointing to potential undervaluation highlight that ICON's underlying demand pipeline and cash flow profile remain central to the story, even as near term earnings are under pressure.
- This article explores how ICON's investment narrative is shaped by strong bookings momentum as investors reassess near term earnings pressure.
Compare ICON's setup against a curated group of cash flow focused opportunities by scanning the 33 high quality undervalued stocks that may be pricing in similar earnings pressure but stronger long term potential.
ICON Investment Narrative Recap
To own ICON here, you need to believe that the large backlog, AI enabled tools and expanded labs eventually show up as healthier direct fee revenue and better margins. The immediate story is tougher. Wall Street is braced for lower earnings and revenue for the September 2026 quarter, so the key near term catalyst is simple: execution on that backlog.
The biggest operating risk right now is that mix and control issues swamp that execution. Pass through and functional service work have already coincided with thinner adjusted EBITDA margins, and profit margins sit at 0.3% versus 9.4% a year ago. Any lingering fallout from the accounting investigation or weak conversion of bookings into direct fees would keep that pressure in place.
The most relevant recent development is the confirmation that ICON expects 2026 revenue to decline about 3% to 4% on a constant currency basis, with direct fee revenue projected to fall roughly 2% organically and pass through revenue broadly flat. That framing matters as you head into the October 27 report because it sets a low bar for near term growth while putting more weight on what the order book can support beyond 2026.
Layer that onto the current DCF work and relative value markers and you get a clear catalyst map. The upcoming earnings release tests three things at once: whether bookings still build, whether margins stop compressing further and whether internal controls stay clean after the investigation. Any sign that AI tools, labs expansion in places like Singapore, China and San Antonio, and process standardization are feeding through to steadier cash generation will be what investors watch first.
ICON Forecasts And What Has To Go Right
ICON's narrative projects US$9.1b revenue and US$716.2m earnings by 2029. This assumes 3.3% yearly revenue growth and an earnings increase of about US$689m from US$27.0m today.
These figures ask you to match analysts on two fronts. First, accept that a business earning US$27.0m today can scale to more than twenty times that profit pool by 2029. Second, assume that a 3.3% annual top line lift is enough for that earnings ramp once margins move from 0.3% toward 7.8%.
ICON investors are effectively underwriting a story where mix, pricing and productivity do most of the heavy lifting, not rapid headline revenue expansion. The implied margin bridge from 0.3% to 7.8% carries more weight than the growth rate itself, since the same US$9.1b revenue level would look very different at current profitability.
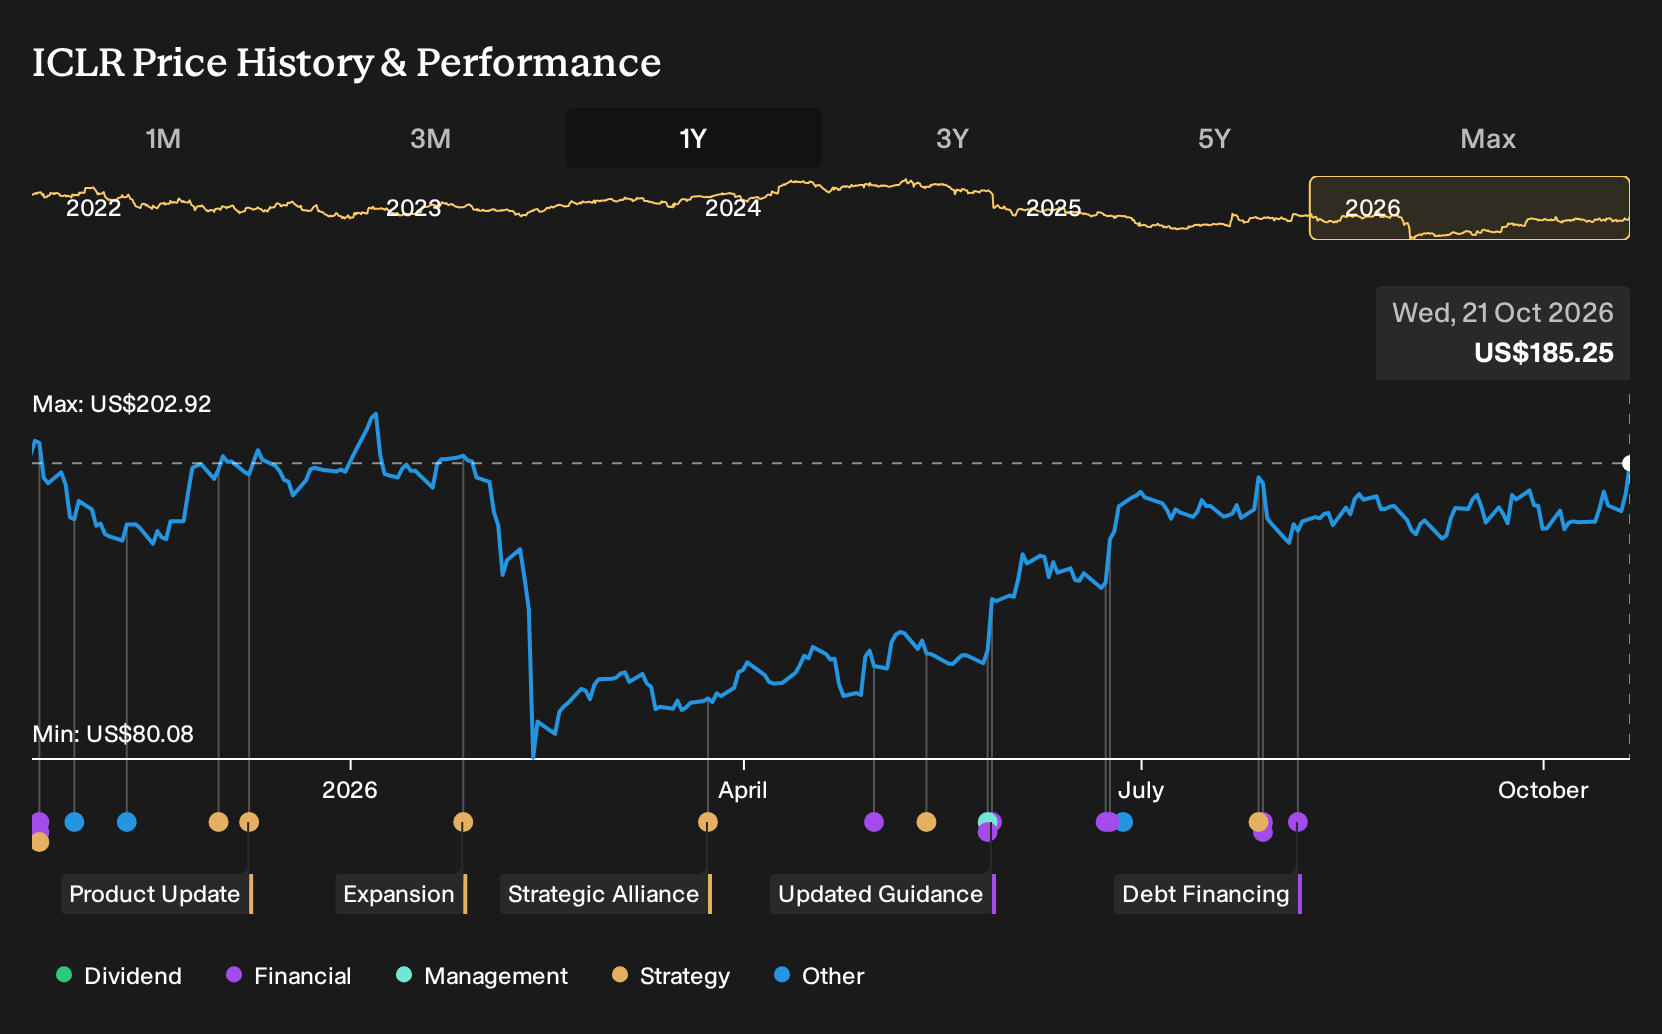
Consensus targets roll these inputs into a fair value view. At a current share price of US$169.99, the average analyst target of US$186.76 sits about 9% higher, with the broader range stretching from US$155.00 to US$220.00. That spread shows there is real disagreement about how cleanly ICON can move from today's compressed margins and control issues to the forecast US$716.2m earnings line.
On the earnings multiple side, the story is about compression. The stock is referenced at a P/E of 485.0x on current earnings, and analysts frame their 2029 target case on a P/E of 27.1x, which they note is below the US Life Sciences industry average of 41.0x. Holding that kind of multiple shift in mind is important when you think about downside if the margin and control repair work does not land as planned.
Forecasts also build in modest share count growth, with expectations that outstanding shares rise around 1.04% per year over the next three years. That assumption matters for any investor leaning on EPS targets, since even a clean operating recovery can deliver flatter per share outcomes if buybacks lag or dilution runs ahead of plan.
Uncover why ICON's fair value indicates ICON is roughly in line with its current price.
Exploring Other Perspectives
One alternate angle on ICON focuses on margin risk rather than backlog strength. The most bearish analysts were only penciling in about US$8.9b of revenue and US$500.3m of earnings by 2029 before this earnings release. That is a much tougher story than consensus, and it shows how far opinions can stretch. Use this report as a chance to compare those forecasts with your own expectations and to explore several competing viewpoints that may shift once the new numbers land.
Explore 5 other ICON fair value estimates, including one that suggests as much as 14% downside from the current price.
Form Your Own Verdict
Disagree with existing narratives? Extraordinary investment returns rarely come from following the herd, so go with your instincts.
- A great starting point for your ICON research is our analysis highlighting 3 key rewards and 2 important warning signs that could impact your investment decision.
- See our latest analysis for ICON. The report includes a comprehensive fundamental analysis summarized in a single visual, the Snowflake, making it easy to evaluate ICON's overall financial health at a glance.
Looking For More Investment Ideas Beyond ICON?
If ICON's setup has you thinking about portfolio balance, it can help to weigh it against other companies with different strengths and risk profiles using the Simply Wall St Screener.
- For investors who care most about financial resilience and steady balance sheets, review a curated list of solid balance sheet and fundamentals (25 results) that can act as anchors in a more volatile portfolio.
- If income is a priority and you want payout strength to do more of the work, scan a focused group of 7 dividend fortresses that may better align with a yield driven approach.
- When the goal is to find quality at a reasonable price, compare ICON with a hand picked set of 21 high quality undiscovered gems that couple solid fundamentals with quieter investor attention.
Have feedback on this article? Concerned about the content? Get in touch with us directly. Alternatively, email editorial-team@simplywallst.com