
- PRICING
- LIVE QUOTES
- LEARN
- HELP


EN
Heritage Financial (HFWA) Pulls Back On Mixed Performance, Where Does Fair Value Sit?
Heritage Financial (HFWA) has drawn fresh attention after recent trading left the share price at $27.68, with performance mixed over the past week, month, and past 3 months for the regional bank operator.
Over the past year, Heritage Financial has combined a 16.8% year-to-date share price gain with a 25.0% one-year total shareholder return. This sits alongside a much stronger 96.6% three-year total shareholder return, which hints that longer-term momentum has been stronger than the recent 90-day share price pullback of 8.6%.
Scan Heritage Financial alongside a hand picked list of solid balance sheet and fundamentals (25 results) to see how this regional bank compares in balance sheet strength and fundamental resilience.
Heritage Financial has pulled back over the past quarter while still carrying a value score of 3 and trading below both analyst targets and intrinsic estimates, so where does fair value really sit in that spread?
Most Popular Narrative: 15% Undervalued
Heritage Financial's most followed valuation narrative pegs fair value at $32.40, which sits above the recent $27.68 share price and frames the recent pullback as a discount to that long run view.
The main factor that has to go right is successful execution on the Olympic and Kitsap integrations so that loan repricing, cost savings and balance sheet flexibility appear in clearer post-conversion expense and margin numbers.
The current share price implies the market is discounting Heritage Financial’s capital returns, earnings beat and margin improvement, which some view as consistent with the perspective that the stock is undervalued.
See why 2 investors see Heritage Financial as 15% undervalued.
Result: Fair Value of $32.40 (UNDERVALUED)
Still, Heritage Financial’s story can unravel if credit issues in commercial loans push nonaccruals higher, or if rising deposit costs squeeze the net interest margin harder than expected.
Find out about the key risks to this Heritage Financial narrative.
Another View: What Multiples Say About Heritage Financial
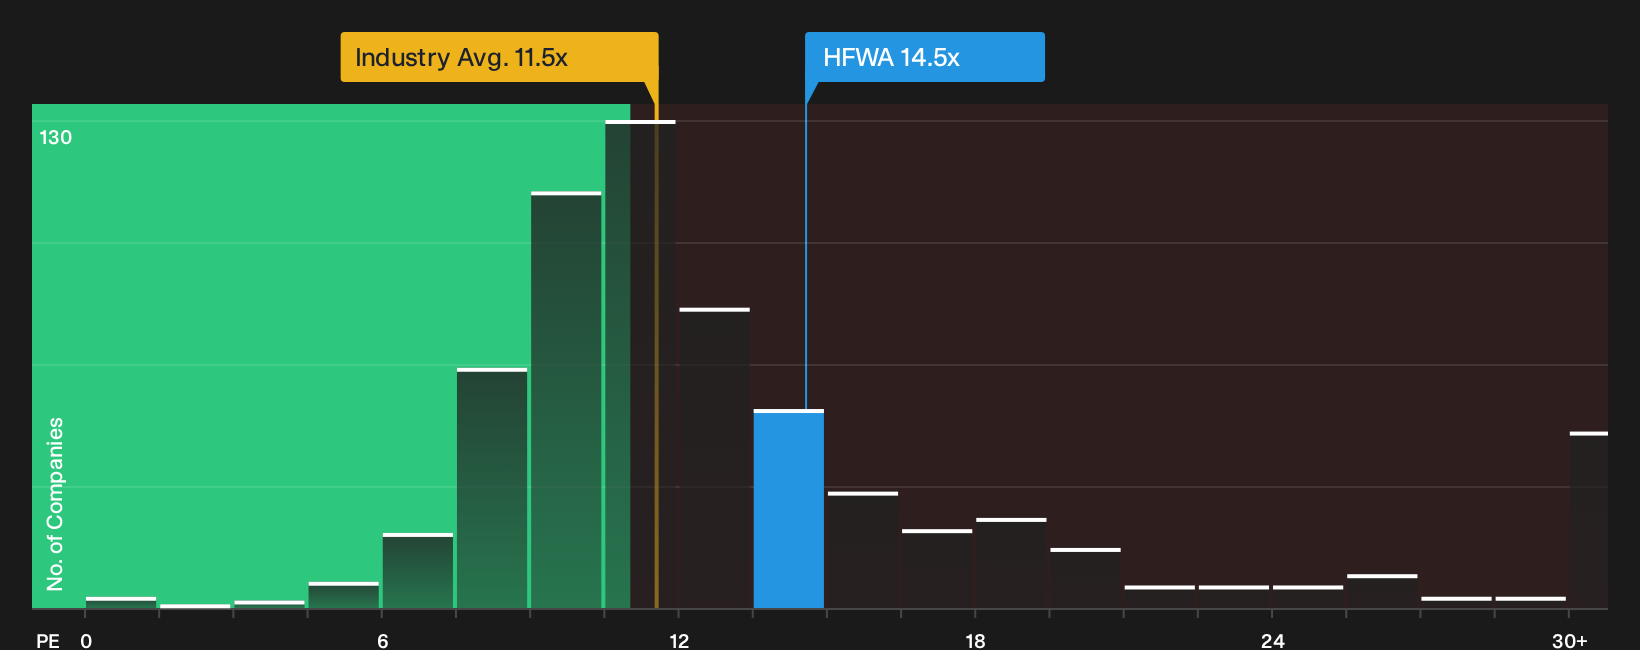
While the SWS fair value model points to Heritage Financial trading 33.5% below estimated intrinsic worth, the current 14.5x P/E tells a different story. That ratio is higher than the US Banks industry on 11.5x and above a fair ratio of 13.6x. Is the discount real, or just thinner than it first appears?
For a closer look at how this earnings multiple stacks up against peers, and where the fair ratio suggests the market could shift over time, See what the numbers say about this price — find out in our valuation breakdown.
Next Steps
Mixed messages on valuation and risk can be useful if you test them against your own research and risk tolerance, so pressure test the data, dig into the full context, and weigh the 3 key rewards and 3 important warning signs
Looking for more investment ideas beyond Heritage Financial?
If Heritage Financial has you thinking harder about value and risk, do not stop here. Broaden your watchlist with a few focused stock idea lists.
- Target stronger upside potential by scanning a curated pool of quality value candidates through the 33 high quality undervalued stocks.
- Prioritise resilience and capital preservation by reviewing a 31 resilient stocks with low risk scores that filters for sturdier balance sheets and steadier track records.
- Spot underfollowed opportunities early by working through a 21 high quality undiscovered gems that highlights companies with solid fundamentals that many investors may be overlooking.
Have feedback on this article? Concerned about the content? Get in touch with us directly. Alternatively, email editorial-team@simplywallst.com